People like me are often accused of not taking note of the high-ranking published data on the danger of SARS-CoV2 and the effectiveness of vaccination. I do take note, and I want to take this opportunity to say a few words about it.
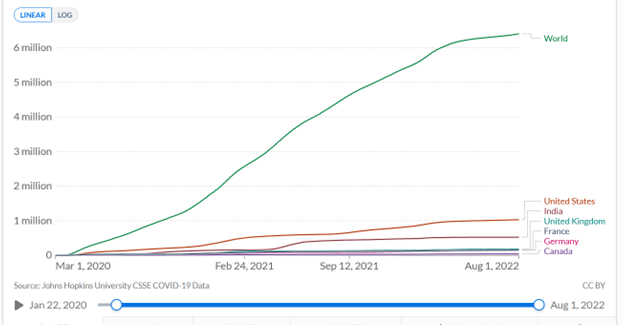
A recent publication in Lancet Infectious Diseases [1] estimates that Covid-19 vaccinations have prevented 18 million Covid-19 deaths. This is a steep claim given that 6.4 million deaths involving or caused by Covid-19 have been reported worldwide to date (https://ourworldindata.org/covid-deaths, accessed Aug. 2nd, 22; see Fig. 1)
Given the time course, it is hard to believe in a clear effect of vaccination. I map in Figure 2 the smoothed daily Covid-19 deaths worldwide, as provided by the website “Our World in Data (OWID)”; in Figure 3 the data for the USA; in Figure 4 the data for Germany.
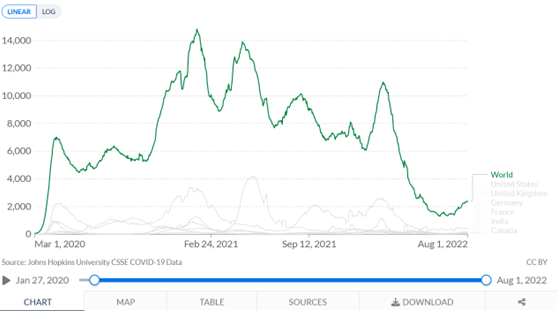
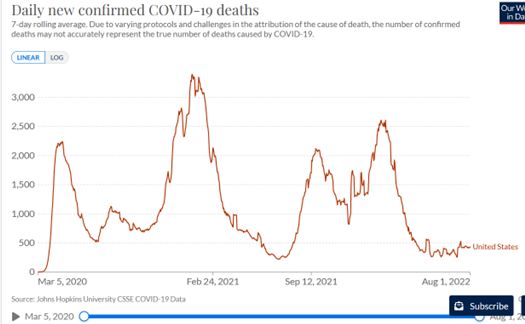
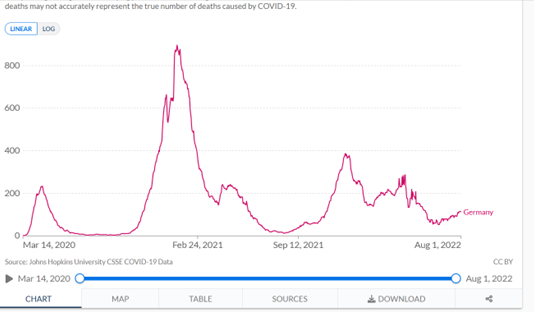
Let’s just look as naively as possible at Figures 2-4, which show daily deaths with Covid-19, smoothed over a weekly window. Let’s pretend there has never been any intervention against Covid-19, no lockdowns, no vaccinations. What would these figures tell us?
They would tell us that a mortality peak emerged worldwide in early March, with up to about 7,000 deaths daily, which quickly dropped off. Using the very easily visible light grey curves in Figure 2, which show the data for the US, England, Germany and Canada, we could say that this dynamic played out in roughly similar ways in these countries.
If we knew nothing about vaccination campaigns, we would see from Figures 2-4 that at least 3 more waves passed through the country by the summer of 2022, all of them more severe than the first wave of March 2020.
Now we know, however, that in late 2020, just as the 2nd wave of Covid-19 deaths was on the rising flank, the vaccination campaign began, worldwide. I had said in my methodology blog on time series that it is very difficult to estimate effects from raw time series data. At best, what you can see is the absence of effects. And that is exactly what we can do here: We don’t see any effect of any measures, lockdown or vaccination on the dynamics of daily deaths. Because if we did see any, we would expect them to decrease. But they don’t. They are rising, three times in Germany and the US and four times worldwide. Each time, the peak is higher than or about the same as that of the first wave. So there is no question of any measure having a dampening effect on Covid-19 mortality. I had shown a figure in my last blog, which I include again here. It shows the “all-cause mortality” as published by the CDC on 6/22 (Figure 5; note: these are weekly raw numbers; Figures 2-4 are based on smoothed daily numbers).
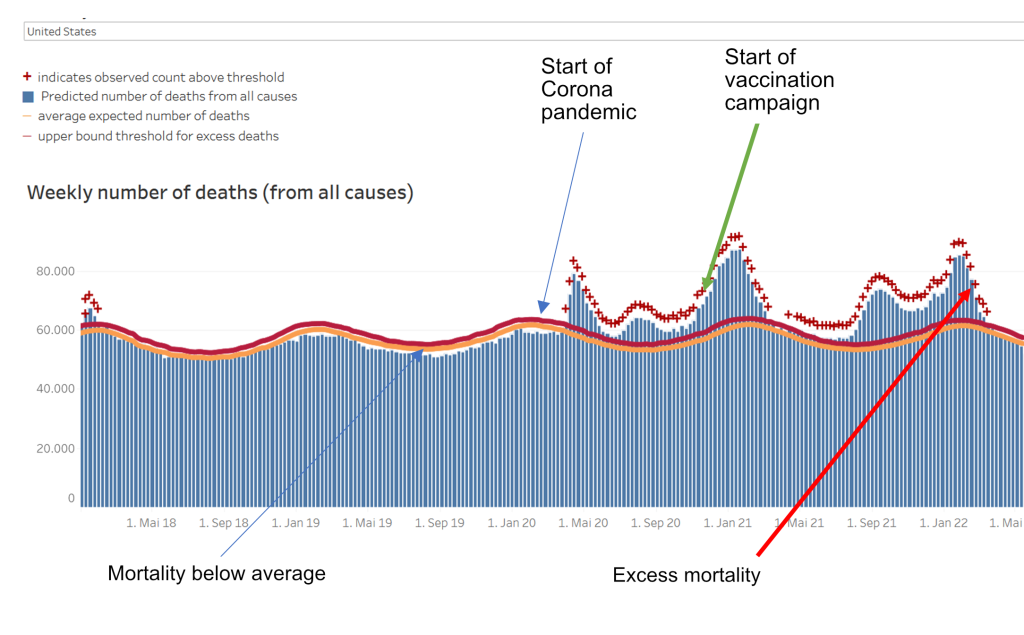
You can also see from this data: There is no effect of any intervention on all-cause mortality. Since the protagonists of the Covid-19 mainstream narrative assume that the main source of excess mortality after 2020 is the Covid-19 pandemic, the salvation provided by vaccination should be visible here, too. It is not.
How does the apparent discrepancy come about?
We now go a step further and ask: How does this discrepancy come about: on the one hand, the claim of a prevention of 18 million deaths by vaccination, on the other hand, the apparent invisibility of this effect in the data?
1. Publication is mathematical modelling and, like all modelling, is dependent on the data
The Lancet Infectious Diseases publication [1] is a mathematical modelling study. And one that is not based on real data, but on hypothetical data. So it is on the far right in my scheme of modelling studies (https://harald-walach.info/25-models-and-causality/ Fig.1). It calculates with hypothetical data and tries to estimate future effects.
Central to this is the information contained in the first sentence of the “methods”: “For this mathematical modelling study, we used a previously published COVID-19 transmission model16, 17 and fitting framework 18 to obtain profiles of the COVID-19 pandemic in each country“. This means: the authors used already published models to calculate their data. In other words, they did not use real, existing data, which actually exist in heaps by now, but they generated their data themselves. How something like this can go through a peer review process at this point is completely beyond me. But the procedure is understandable: if you have a model, you can simply generate the data. Otherwise, you would have to get it and fit a new model. That is very time-consuming for a big enough chunk of the 194 or so countries of the world. Then rather use already existing material.
Now, one has to look extremely carefully at such information. I have made it a habit to always follow such information to the source, and have always given my students the old mnemonic: “Ad fontes – to the sources“. Only those who go to the sources find out the truth. This applies to many modelling studies, by the way.
If one does this for a modelling study published not long ago [2], which the University of Witten took as the basis for the FFP2 mask requirement at lectures, one finds – one has to go backwards over three self-citations – that the authors of this study used the highest ever published viral loads of SARS-CoV2 to feed their model. If one does that with this study now under discussion [1], one notices that references 17 and 18 cited above are also models [3, 4], which incidentally come from the same working group and ultimately rely on the ill-fated model of Ferguson [5], who is apparently the spiritus rector of this working group, or at any rate closely intertwined with it.
These models date from the early days of the SARS-CoV2 pandemic and are based on unrealistic assumptions that have since been recognized as false:
- That the pandemic will affect everyone and that there is relatively little protection
- That it can only be reduced in effect by policy action
- That there is no existing immunity to it
Interestingly, the paper also does not cite or engage with any positions that have assessed these very models as problematic [e.g. 6].
We note: The paper does not use real-world data, but uses its own modelling of the future as the data basis for estimating effects.
2. The real data do not match the predicted data
A modelling exercise is only as good as the data it is based on. The data basis of this study is, as said, the model calculated by the working group, not the real data. These calculated and predicted data and the real ones diverge. For example, the Imperial College model by Walker, Ferguson and colleagues [3] predicts death rates of about 3,000 to 7,000 Covid-19 deaths per 1 million population by country, depending on the country’s income stratification, health system and containment strategy (this can be seen in Figure 4E of [3]). As an example of a high-income country with “unlimited healthcare”, i.e. a very good healthcare system without any restrictions, let us take Germany. According to this calculation, it would have about 5,000 deaths per 1 million inhabitants. With a population of about 83 million, that would be about 415,000 Covid-19 deaths, incidentally about the same number that Ferguson predicted at the time but which never materialized [5]. “Our World in Data (OWID)” reports a cumulative 144,150 Covid-19 deaths for Germany as of Aug. 2nd, 22 (https://ourworldindata.org/covid-deaths accessed Aug. 2nd, 22).
Let’s take another example: Walker and colleagues [3] calculate in their model that a low-income country without good health care would have about 7,000 Covid-19 deaths per 1 million population. We take Uganda for this because the same publication in Fig. 1E claims that 100% of the population would be infected and thus exposed to the disease without protection. Uganda has about 41 million inhabitants and should therefore have 287,000 Covid-19 deaths. Uganda has reported 3,628 Covid-19 deaths as of Aug. 2nd, 22. Even if we take into account that the reporting systems in Africa are not as good as we might need them to be and use a factor of 10 to correct for this, we are still under the predicted data by a power of ten.
3. The publication uses the model to predict expected deaths and calculates the difference between expected and actual deaths as the “success of vaccination”
This sentence really says it all. If I use a completely inflationary predictive model to calculate the expected number of deaths from Covid-19 and then subtract the effective number of deaths from that and interpret the difference as vaccine-prevented deaths, then of course I have set up a perfect self-validating citation machine that launches one stun missile after another.
How could it have been done differently?
Well, one could have used, say, the real deaths up to December 2020 to correct the model. This obviously did not happen. Because then – you can see that even without statistics – everything that is visible after 2020 would have become visible as a comparatively large excess mortality, which leaves no chance at all to find a positive vaccination effect. It would also have been possible – and this is our next project – to define different points in time for each country, for example at which 20%, 40% or 60% of the population is vaccinated, and then calculate a country-specific regression on the deaths four weeks later. If vaccination has a positive effect in a country, there should be a negative regression coefficient, the size of which could be used to estimate the effect of vaccination. Or, one can simply look at the curves (Fig. 2 – 4) and see: If anything, there is a worsening effect. I do not think it is permissible to attribute this to the vaccination, as some people like to do. For it could be that the virus has become more aggressive, that the reporting systems have become better, that more counting and testing has been done, etc.
Summary:
So the problem with this publication is that it does not use real data to model the number of Covid-19 deaths, but predicted data without having adjusted or changed it based on reality. Therefore, this study is completely useless, it says nothing about the effect of vaccination. In my view, this study should be withdrawn. However, that is most likely not going to happen.
How can it be that such data is published in a high-ranking journal?
Maybe we should take a quick look at the psychology of science to understand how such a thing can happen in the first place.
For one thing, there is the conflict of interest: The one who pays the piper calls the tune. The study was co-financed by some institutions that have a financial or ideological interest in the Covid-19 vaccination or both (CEPI, BMGF). Such conflicts of interest regularly cloud the view.
On the other hand, there is the argument of loss of face. Anyone who once blew a horn as hard as Ferguson and his working group did would pretty quickly lose credibility (and perhaps even face recourse claims) if they published openly: “Sorry folks, we fooled ourselves (and you), sorry to all the many small businesses, freelancers, restaurants, schoolchildren we’ve needlessly bankrupted or stung by the lockdown we advocated.” That would also mean: End of funding, end of the possibility to continue with projects, loss of reputation within the institute and possibly loss of other funding we don’t even know about. So rather: close your eyes and move on.
By the way, this also means: presumably the authors are convinced that they are right. That is the only way to keep such machinery running. This raises the question of the psychology of error. This is closely linked to personal virtues and qualities. Only a few people have the stature to admit an error publicly. And the more depends on it, the harder it becomes. Especially if one’s own self-image, as well as one’s career, depends on it. It is psychologically easier to close your eyes and convince yourself that you are right. After all, you still have to be able to look at yourself in the mirror.
Regarding the publication process, this is easy to understand: Lancet Infectious Diseases is a good journal, but not a top journal. Either the authors did not even try elsewhere (Lancet, JAMA, BMJ, New England Journal of Medicine) or were rejected there and then went to the second division. In such a journal, tough competitive considerations also prevail: If you publish a prestigious paper, you collect impact and citation points. Everyone likes to hear the message that vaccinations have saved 18 million lives. It gets heard, quoted, picked up, tweeted, covered in the news and boosts reputation. An editor who believes the mainstream narrative, and other editors are hardly active in the major journals, will therefore implicitly seek reviewers who are inclined to such a message and the working group.
The Lancet journals are among those that generate much of their income from offprints that companies send to their clients and that are tucked into attendees’ conference folders at congresses or given away at company stands. For Lancet, the figure was 41% in 2005, and the journal sold 11 million offprints at that time [7]. Conflicts of interest mean that products for which one gets sponsorship are objectively better off in studies [8]. All this leads to an editor sending data that he welcomes into a benevolent review process: He chooses reviewers he believes will look on the matter with favour; he weights potentially critical reviews in association with positive ones accordingly. Every editor has the option, if he or she wishes, to have publications that are politically convenient to him or her reviewed in such a way that he or she can accept them without having to distort the review process in any way. And equally, every editor has the option to do the opposite.
Furthermore, we should never forget: The process of science is a process of discourse. Data are published, doubted by others, challenged by other data or other interpretations, etc. A study does not end a discussion, it can at most open it. Only a lot of data that show the same outcome and remain unchallenged have a chance to end a discussion, and not even that happens often.
So now it is time to contradict and time to publish other, better data.
Quellen und Literatur
- Watson OJ, Barnsley G, Toor J, Hogan AB, Winskill P, Ghani AC. Global impact of the first year of COVID-19 vaccination: a mathematical modelling study. Lancet Infectious Diseases. 2022. doi: https://doi.org/10.1016/S1473-3099(22)00320-6.
- Bagheri G, Thiede B, Hejazi B, Schlenczek O, Bodenschatz E. An upper bound on one-to-one exposure to infectious human respiratory particles. Proceedings of the National Academy of Sciences. 2021;118(49):e2110117118. doi: https://doi.org/10.1073/pnas.2110117118.
- Walker PGT, Whittaker C, Watson OJ, Baguelin M, Winskill P, Hamlet A, et al. The impact of COVID-19 and strategies for mitigation and suppression in low- and middle-income countries. Science. 2020;369(6502):413-22. doi: https://doi.org/10.1126/science.abc0035.
- Hogan AB, Winskill P, Watson OJ, Walker PGT, Whittaker C, Baguelin M, et al. Within-country age-based prioritisation, global allocation, and public health impact of a vaccine against SARS-CoV-2: A mathematical modelling analysis. Vaccine. 2021;39(22):2995-3006. doi: https://doi.org/10.1016/j.vaccine.2021.04.002.
- Ferguson N, Laydon D, Nedjati Gilani G, Imai N, Ainslie K, Baguelin M, et al. Impact of non-pharmaceutical interventions (NPIs) to reduce COVID19 mortality and healthcare demand. London: Imperial College, 2020.
- Daunizeau J, Moran RJ, Mattout J, Friston K. On the reliability of model-based predictions in the context of the current COVID epidemic event: impact of outbreak peak phase and data paucity. medRxiv. 2020:2020.04.24.20078485. doi: https://doi.org/10.1101/2020.04.24.20078485.
- Lundh A, Barbateskovic M, Hrobjartsson A, Gøtzsche PC. Conflicts of interest at medical journals: The influence of industry-supported randomised trials on journal impact factors and revenue – cohort study. PLoS Medicine. 2010;7(10):e1000354. doi: https://doi.org/10.1371/journal.pmed.1000354.
- Lundh A, Sismondo S, Lexchin J, Busuioc OA, ., Bero L. Industry sponsorship and research outcome. Cochrane Database of Systematic Reviews. 2012;(12):MR000033. doi: https://doi.org/10.1002/14651858.MR000033.pub2.