
Let us begin with a little quiz. I recently found the following text on disastrous conditions in German intensive care units in a scientific journal. A survey among nurses is reported there, and the authors write:
Intensive care – care of the population in jeopardy
“When asked about a general dissatisfaction in the profession, 68 percent [of the intensive care nurses surveyed]responded with a “yes”. A worsening of working conditions in recent years was felt by 97 percent of the respondents.” 97% say that the workload has increased significantly, and working conditions have worsened considerably. 37% want to leave the profession, 34% want to reduce working hours. “The reasons for the poor working conditions mentioned by intensive care nurses are clear. They include the high workload, low esteem especially by hospital owners, poor care and staffing ratios, and mediocre pay.”
Prize question: what year is this text from?
It is from 2019 and refers to a survey from before [1]. Even then, on March 8, 2019, intensive care physician Karagianidis sounded the alarm and wrote that the care of the population was in jeopardy. And this is not because we have too little capacity, but because we treat our medical staff too poorly. In the same paper, Karagianidis and colleagues note: Germany has by far the highest intensive care bed capacity in Europe. The problems are structural, nurses are paid too little. The hospitals, especially the private ones, want (and need) to make profits and do so by cutting personnel costs. Employers give nurses too little appreciation in the form of adequate pay, flexible services, sufficient time, etc. It is worth looking at the graphs of the statistics in the original paper. They tell you everything you need to know.
What has happened since then? Have politicians taken this warning to heart? Not that I know of. If you want to know for sure, take a look at this answer by the federal government in the Bundestag on 9.9.2021. The Federal Government sees “no need to promote the expansion of further intensive care treatment capacities“, as it lets the public know in September 2021. After all, it had done everything that was necessary. A closer look at this answer reveals policy failure all along the line. Less than two months later, the political landscape from Munich to Berlin is screaming: The unvaccinated are clogging up the intensive care units! State of emergency! Triage! Helicopters!
What exactly is going on? I recommend a look at https://intensivstationen.net/, a private initiative by programmer Tom Lausen. He has looked at health care data from the ground up and implemented a way to match the data that the RKI provides to the German Intensive Care Register with the data that the hospital billing office reports; the latter are, in fact, more accurate. It makes the result available on its website, updated daily. If you care to look, you will see that the reserves have decreased slightly – Mr Lausen says why in an interview – but an overload is far off. On this page there is also a reference to his new book, where the details are described. I can say this much:
A system with wrong incentives
The current Hospital Financing Act replaces an old scheme. In the old scheme, hospitals received subsidies if they provided intensive care beds. That meant beds with oxygen connections, possibly also oxygen equipment. Now they receive compensation for cancelled operations, €50,000 per operation, if the intensive care units are at least 75% occupied, if a certain number of these occupants are Covid-19 patients and some other conditions are met. The cancelled surgeries have to be proven by list. Karl Lauterbach called this an “invitation to fraud” in an interview with BILD. Will he still see it that way today and change it? We will see.
I advise all readers to delve a little into the interview with Tom Lausen and his website. Because then it will become clear:
- We are not short of intensive care beds. If we have a problem it is this: We have a health system that sets the wrong incentives and poorly remunerates staff, scares them away and therefore creates bottlenecks. This has been the case for a long time, not just since Corona. I discussed this back in 2011 and then again a few years ago [2].
- The Corona patients are not the problem. You can see from this graph: they make up a very small percentage of all beds now and always have. About 32,000 people are in intensive care units in the course of a week. About 5,000 of these are corona patients, says Mr Lausen. Even if all of these patients were unvaccinated, no unvaccinated corona patients would clog up the ICUs because these patients don’t clog up anything at all. It has always been the case that some wards were full in the winter flu season and patients were transferred elsewhere. That was routine. Only back then there were no camera vans outside the hospitals.
- The majority of Corona patients in intensive care units are very old people over 80. Patients in intensive care units have always had this average age. Our society has forgotten how to deal with death. It pushes it into the intensive care units, where all kinds of things are done to the old, seriously ill people – I deliberately don’t say patients – sometimes sensible, often nonsensical, which delays death by a few days, a few weeks. That generates money. Most of the money that health insurance companies pay into the health system is due in the last weeks of a person’s life. Precisely because of the many intensive treatments. This has very little to do with Corona, but rather with a misguided incentive system in the health system.
- The heaviest load on intensive care units in recent years was in the winter months at the end of 2019, beginning of 2020, i.e. even before the pandemic was declared. It is possible that the virus was already undetected among us. Possibly it was simply the normal winter chaos with severe respiratory infections in old people, from which very many of them die in the normal case.
So it is wrong to say Corona is a problem because it overloads the health system. The health system has always been overloaded in the winter months, not because of Corona, but because of bad health policies. It would be good if someone in charge, now it’s Lauterbach’s turn, would admit that and would stop using false arguments, dividing society.
Unvaccinated people are not the problem
The unvaccinated are not to blame for anything at all. This narrative, which seems to have been served mostly by very unsophisticated voices in the press and politics lately, and picked up by countless social media activists, is a fission fungus of the first order. It divides society in a way that we have not experienced in Germany for a very long time. It is so perfidious because it is factually – very easily verifiable – wrong.
Just recently, a very illustrious team of authors [3] supported a House of Lords paper in the British Medical Journal. It warns against introducing compulsory vaccination for medical staff in England [4].
The authors [3] point out the following facts:
- The transmission of infection is the same between the vaccinated and the unvaccinated [5]; this has just been shown again in a study in a US prison [6]. In plain language, vaccination does not protect against transmission of infection and does not break chains of infection.
- Vaccinations are prone to side effects. For example, myocarditis is increased by a factor of 1.42 after the first vaccination, 5.34 after the second vaccination (these are the standardized incidence rates versus background incidence) and are particularly high in young men between 16 and 20 [7]. So if you are vaccinated as a young man, and you are under 20, you have a 13.6-fold increased risk of getting myocarditis. And myocarditis is not a sore muscle. It’s an inflammation of the heart muscle tissue. Yes, it often heals after three weeks or so, but sometimes it doesn’t, and sometimes it’s fatal. The point is that most people wouldn’t normally get it, but after vaccination the risk increases. This in a group that is at virtually no risk of morbidity, let alone mortality, from SARS-CoV2.
- What is particularly concerning is that these risks increase with a second vaccination. The risk difference is 3.19 per 100,000 from the first to the second vaccination. It can be assumed that they will increase even more with further vaccinations. The authors [3] point out that there are no studies or data on booster vaccinations, which are now being called for. What kind of system is it where people who have no basis in data can publicly demand that people be given a vaccination that they don’t know works – or is safe? A year ago, that would not have been called democratic. Today, hardly anyone objects to it, because the fear has obviously grown. We all know the phenomenon that when the light is very poor and the sun is very low, even the shadow of a dwarf looks like a giant.
- Vaccinations are extremely poorly studied. Contrary to what published opinion claims, the clinical trials that are supposed to prove the effectiveness of vaccinations have never had a relevant outcome as a target parameter. Not a single study has examined morbidity and mortality, at most symptomatic Covid-19 queried with a mobile app. The data basis for such far-reaching decisions as mandatory vaccination is conceivably poor, not to say miserable. The studies were conducted quickly and sloppily [8]. The data is not available for the vast majority, many studies are not yet completed, but what we have are preliminary reports. Meanwhile, a Canadian civil rights movement has forced the release of confidential study documents by court order. They were made available on Nov 17, 21 and Dec 13, 21 and are dated April 30, 21, so they are reasonably old. It speaks volumes that publicly relevant documents have to be litigated by court order.
- Many studies are now unblinded, so we have no long-term observations. Peter Doshi and colleagues point this out [9, 10]. And, as I keep pointing out: there is no study of large numbers of people, say a million, who have been actively observed for a long enough period after vaccination. I always ask all kinds of people. So far, no one has shown me such a study and, to my knowledge, none is in the works.
- I’ll add the following point: If you look very closely, you can see that the harm these vaccinations may do outweighs the benefits. It may be true that in the short term the risk of infection is reduced and illnesses are somewhat milder if one catches SARS-CoV2 and was previously vaccinated. But the closer you look, the more clearly you see worrying signals. For example, cardiologists indicate an accumulation of cardiological and vascular problems [11-13].
Risk-benefit estimates
This has led some authors to conclude in a risk assessment that the potential deaths attributable to vaccination as a cause exceed the deaths prevented by vaccination [14]. The problem is that we don’t know because we don’t have the relevant data. We don’t have clinical trials that have used mortality or hospitalization as an outcome, and therefore could prove that vaccination prevents deaths and hospitalizations. We draw that out of shaky statistics. And we don’t have any long-term observations that document exactly how many deaths and serious side effects are the result of vaccinations. So we are in the fog. Kostoff and colleagues [14] argue: Empirical studies have shown that the adverse events recorded by passive reporting systems such as the US Vaccine Adverse Event Reporting System (VAERS) or the German Paul Ehrlich Institute accounted for only about 1% of the actual data.
This was recently made clear by the Canadian Covid-Care Alliance in a presentation, here’s the video, in which they discuss the latest data from the Pfizer pivotal study and its problems, as well as a confidential Pfizer safety study available on the above website available.
In the Pfizer study published in November [15], which includes a 6-month observation, the advantages and disadvantages probably balance out. The effectiveness, i.e. the relative superiority of the vaccine in preventing symptomatic infections, is 91%, which is impressive. But one has to consider: we are talking about 81 out of 22,186 people, i.e. 0.36 %, in the vaccination group and 873 out of 22,320 people in the placebo group, or 3.9 %. This results in a vaccine effectiveness of 91 %, and this against the background of a very low prevalence. In other words, very few people, vaccinated or unvaccinated, get sick at all. If one were to use a hard clinical outcome in such a study, death or hospitalisation, then one would certainly have to include a factor of 100, possibly even 1,000 times more people in such a study to be able to see any effect at all. These are the clinical results that are really interesting, all these studies do not make any statements about these. But when it comes to vaccination, a lot of people have to be vaccinated to prevent death or serious illness. And all of them are exposed to the possible side effects. Therefore, this presentation points out that although there are significantly fewer cases, 91% fewer, there are 300% more side effects, 75% more serious side effects and 10% more very serious side effects, namely 127 in the treatment group and 116 in the control group, as well as 20 deaths (including Covid-19 deaths) in the treatment group and 14 in the placebo group. There are 2 Covid-19 deaths in the placebo group and 1 in the treatment group. Nine of the deaths in the vaccination group are due to cardiovascular problems, compared to 5 in the placebo group, so the number of fatal side effects is 142% greater in the treatment group.
Vaccine adverse events and vaccine deaths in passive monitoring systems
The aforementioned presentation by the Canadian Covid Care Alliance also discusses one of the safety reports submitted by Pfizer and released on Nov 17, 21. This safety report is passive, so does not come from active tracking as one would need, but simply mentions notifications. There were a total of 42,086 reports. I show the composition in Table 1, which comes from the report.
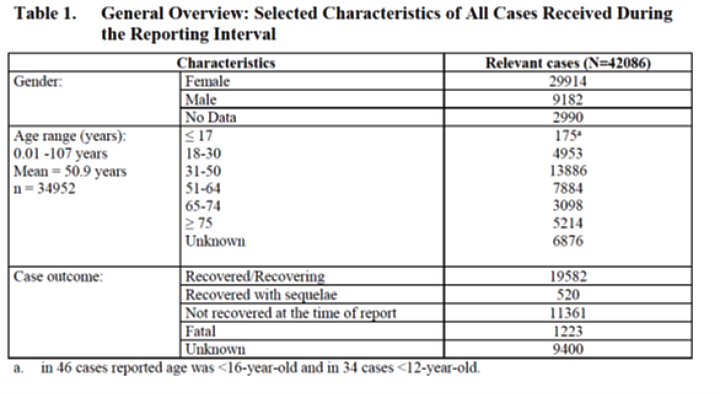
You can see: 1,223 people have died as a result of vaccination, 11,361 have not yet recovered, we don’t know about 9,400 and just under 20,000 have recovered. Is that a lot or a little? We don’t know that either because the report doesn’t give the baseline number of vaccinated people to which that refers. The data is for the first three months of the vaccination campaign, I guess, because it is from April 30, 21. More than 10,000 serious side effect reports relate to the central nervous system. Rare but very serious side effects include demyelination, a type of multiple sclerosis reported in the 6-month efficacy trial [15]. It is reported in 2 patients in 10,000 and is twice as common with vaccination than with placebo. Optic neuritis, an inflammation of the optic nerve, is also reported in 2 in 10,000 and does not occur in the placebo group. Considering that 3% of all reports are deaths, and we don’t know for sure to what extent the vaccine prevents deaths because that hasn’t been studied, I wonder how anyone would call such vaccines well researched and safe. I think that can only be done by someone who is clueless to professional standards or who turns a blind eye to everything.
Paul Ehrlich Institute report: safety data
The Paul Ehrlich Institute (PEI), for example, reports in its latest report, which goes up to and including Sept 30, 21 (I find it a scandal that data is made available two months late in such a sensitive matter): 1.6 suspected cases per 1,000 vaccine doses, 0.2 severe. Fatalities were reported in 1,802 cases. That is 1.7 deaths per 100,000 vaccinations. The PEI shows the distribution in this graph in Figure 1. If Kostoff [14] is right, this would be only 1% of all deaths. The Dutch adverse event database has 4.4 deaths per 100,000 vaccinations [16], the US VAERS has 3.4 deaths per 100,000 vaccinations [17]. If we take 4 as a baseline estimate and use Kostoff’s empirical 99% rule, we would expect 396 deaths due to vaccination per 100,000 vaccinations. Now everyone can decide for themselves whether this is a lot or a little. In my view, it is too much, especially since many of these deaths, not to mention the side effects, will occur in younger people. These younger people would have had a negligible risk of dying from Covid-19 or suffering serious damage from the disease.
We have just completed a representative survey, which we will soon make available as a preprint and then hopefully publish soon. There, 16% of about 800 vaccinated respondents report serious side effects. I think that’s a lot.
Possible mechanisms of side effects
The side effects that can be expected with these vaccinations are likely to arise mainly because of the autoimmunological components. This is because the spike proteins get into all sorts of organs, as Pfizer’s Japanese registration trial shows [18]. There they stimulate an immune reaction – and the more often, the more. This can very easily be derailed. The process, which has been clearly proven at least in animal experiments [19], is a cause for concern. Even more concerning is that the spike protein can also cause changes in the cell nucleus that impair DNA repair mechanisms [20].
So we already have enough ideas why side effects occur, namely due to the same mechanisms, why certain conditions occur in Covid-19 disease: Prof Sucharit Bhakdi and Prof Arne Burkhardt explain this in a recently recorded presentation and describe it in an affidavit. The spike protein triggers all sorts of problems. The difference is that in a natural infection it only enters the system in exceptional cases. Most of the time it sticks to the mucosal barrier, makes inflammation there, which heals and leaves immune protection. The mRNA vaccines bring the antigen into the bloodstream. This is because the muscles where it is injected have a very good blood supply and the cationic nanolipid bodies that coat the antigen and have the job of preventing its immediate degradation, then when it gets into the bloodstream it goes to all sorts of places in the body, into the vessels, into the heart, in fact everywhere, before the lipids are broken down and the spike protein is released. Then wherever it is, it triggers an immunological response. This can lead to autoimmunological destruction of the cells in question. If it goes well, the immune system then down-regulates the reaction. If it goes badly, it derails. In his presentation, Prof. Arne Burkhardt shows the data from a small autopsy study. In all 15 cases, he found large accumulations of killer lymphocytes that led to autoimmune-mediated death. All cases had vaccination as a common feature, and that relatives demanded an autopsy because they suspected a connection. This was confirmed pathologically. In no case would the authorities have taken action on their own initiative, and in no case would this death have been linked to this vaccination if it had not been investigated in detail. Apparently, the immune system attacks sites in the body where cells have produced the spike protein.
The point is: these vaccines use a non-physiological route because the antigens are delivered to the bloodstream, not to the mucosa. And they rely only on antibodies for protection – circulating ones, not cellular ones at the mucosa. What leads to immune protection in a natural disease is omitted: the path via the mucous membranes, the formation of a long-term immune memory. With every new vaccination, the data show, the risk of an overreaction of the immune system and thus of serious side effects increases.
The narrative of the killer virus leads to the sidelines
All of this is only conceivable against the background of the narrative of the killer virus and, above all, the fear that has been generated in the population. We would never, ever have accepted such figures for a flu vaccination or for a normal drug substance that is newly approved. Vioxx was taken off the market after about 160,000 patients had a heart attack or stroke; many of them died. All this was known to the Merck company for a long time [21, 22]. Do we have to wait until the number of deaths increases by a factor of 100? If the number known so far covers a quarter of a year, then we don’t have to wait too much longer.
Why are these vaccines so indispensable? They do not prevent infections; their protection is gone after six months [23] and requires another vaccination, about whose safety and effectiveness we know even less than about the first two. What they do prevent, namely SARS-CoV2 infection leading to illness in some cases and severe illness in a very small number of cases and death in even fewer cases, mainly in people beyond 70 and 80, is not very different in substance from the well-known more severe flu waves of earlier years, as the RKI itself has said [24]. What is different, however, is the media attention and evaluation. It alone has turned a seasonal illness into a killer virus. If there were no cameras and no dashboards [25], there would be no Covid-19, I dare say, at least not in its current presence. There would be a severe cold wave. There would be some sick people coming down with difficult-to-treat pneumonia and of those some would die from it, especially if they are very old or very sick. But there would be no killer virus narrative.
And this narrative alone justifies these decisions: from emergency approvals of vaccines to the political debate about compulsory vaccination. Objectively, this compulsory vaccination cannot be justified or substantiated. The data used to argue is demonstrably wrong. The arguments are demonstrably skewed, even dishonest. How is it to be assessed when a government pursues such a strategy? The majority is caught in a narrative that suggests there is no alternative. Lack of alternatives is always wrong. Because it simply signals lack of imagination and technocrat mentality.
Just now, the president of the Austrian Medical Association has threatened doctors who advise patients to be cautious and do not support the vaccination campaign. The doctors are fighting back in an open letter and calling on the president to resign.
Lockdown
A friend said to me, “Yes, but you have to make a distinction. The situation we have today is without lockdown, but with vaccination. Last year we had the situation with lockdown, but without vaccination. It was worse then. So vaccination has to do something, right?”
Sounds convincing at first glance. Up to the point where one takes a closer look at the lockdown effects. For this, we refer to two studies. One we have just published ourselves [26]. It shows: The original modelling [27] that evaluates the first lockdown as effective is based on wrong data. If you take the correct ones, the effect disappears. The second study has also just been published [28]. It shows, using the example of Argentina, which had the longest and most severe lockdown in the world, compared to neighbouring Uruguay, which had none, that this measure had no impact at all on the incidence of infection. This in turn can be strongly explained by the seasonal fluctuations in UV radiation. I have already pointed this out several times: Looking across different countries, the data show that these non-pharmacological interventions or “measures” have only minimal effects [29, 30]. Therefore, no indirect evidence for the effectiveness of vaccination can be derived from this argument.
Mortality and morbidity: with and without vaccination in Germany
But you should be able to see an effect if we compare morbidity data from 2020 with those from 2021, right? Because in 2021 we had vaccination and this, I remind you, was supposed to reduce the burden of disease, improve everything, normalize life. So we should see fewer cases in 2021 than in 2020 and also fewer deaths in 2020 than in 2021, right?
I had already pointed out: it is not like that in Italy. There, there are only marginally fewer deaths in 2021 than in 2020, but significantly more cases of illness and intensive care [31]. Something similar can be seen in Germany if one takes the data from the RKI. Figure 2-4 shows the deaths in 2020 and 2021 in different age groups, Figure 5 the total number in both years. The plots are smoothed over 5 weeks to make them easier to read.
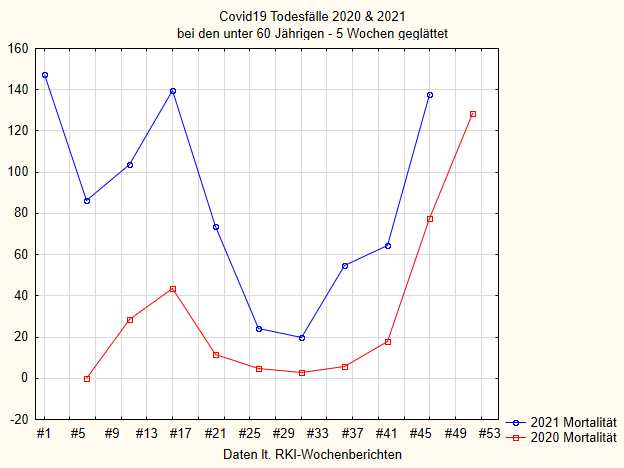
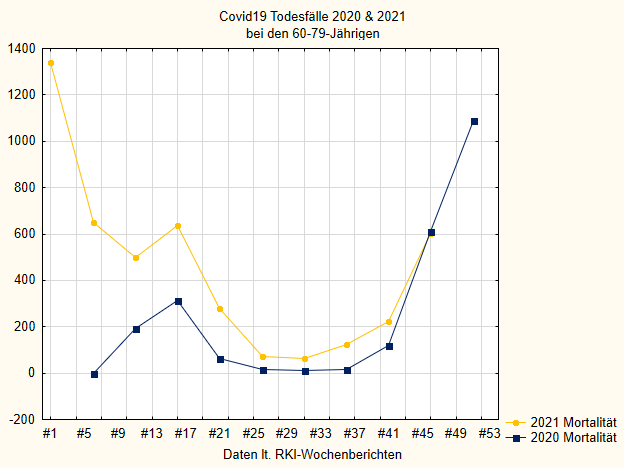
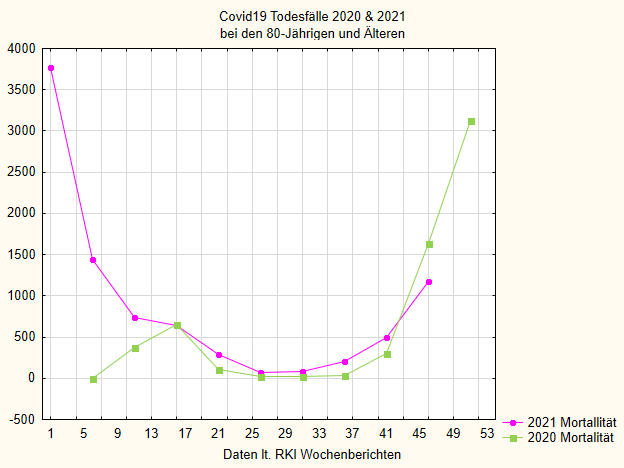
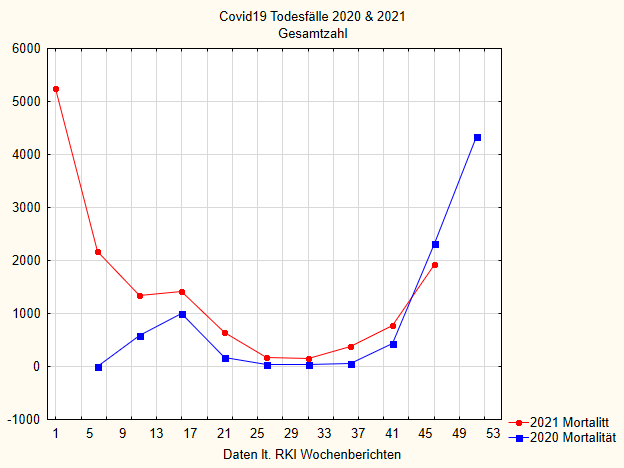
If we first look at Figure 5 with all age groups together, i.e. all people who died “with or from” Covid-19 according to the RKI, we see that mortality in 2021 is higher than in the previous year in all cases except the last few weeks. Since the RKI always reports data with some delay and also many supplements come later, these last data points are not completely certain. Towards the end of 2020, the mortality curve rises sharply; that was the second wave at the end of last year. That’s also where the vaccination campaign started. In line with this intervention, the number of deaths then fell rapidly in early 2021. But interestingly, it rises again in May, when one should in itself expect another steady fall, and remains permanently above the curve of the previous year.
For those 80 and older (Figure 4), the drop is most pronounced and the discrepancy is smallest, but even here it can still be seen. The younger the people who are vaccinated in 2021, the greater the discrepancy.
If we look at the cases that tested positive, we see a very similar situation. I simply plot in Figure 6 the number of total cases per week, again smoothed in the 5-week window, each for 2020 and 2021. By themselves, one would have to standardise these numbers to the number of tests. But since the RKI still does not provide these figures in the weekly reports and it was too tedious for me to compile these figures, I have omitted this standardisation. For our purposes, these figures are sufficient. I will spare the presentation of the age groups separately; there it is similar to Figures 2-4.
We also see here that in 2021 the number of cases was higher than in 2020.
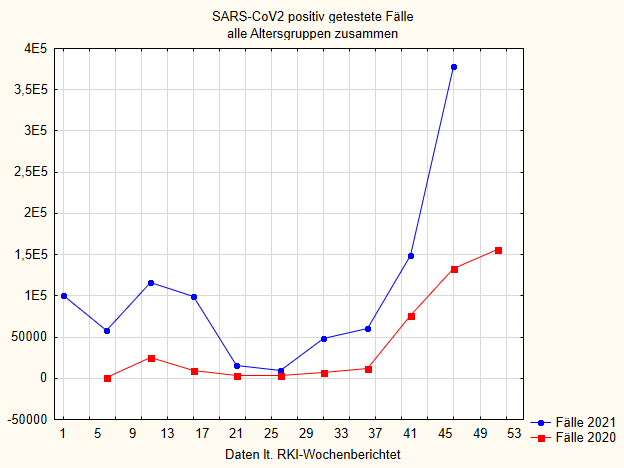
At the beginning of 2021, when the vaccination campaign starts, the cases decrease, only to increase again and even continue to rise during the summer. They are always well above the 2020 figures and now, towards the end of the year, they are rising dramatically.
The steep rise in the 42nd calendar week of 2021 took place despite the fact that at that time, vaccination coverage among 18-59 year olds was over 72% and among the elderly, 75-80% coverage had taken place earlier.
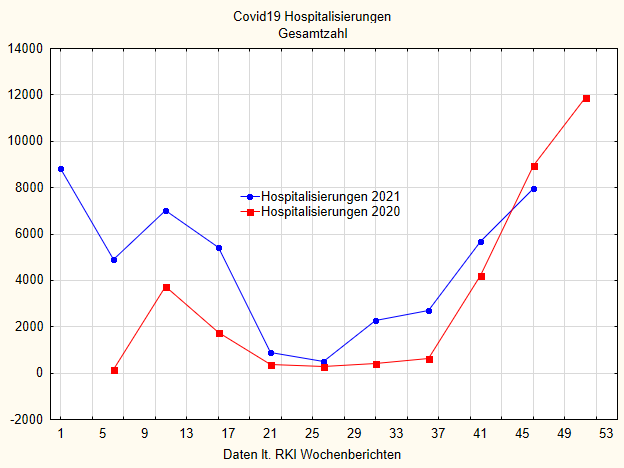
What about hospitalizations due to Covid-19? Likewise. In all three age groups, the hospitalization figures are higher in 2021, and in every week than in 2020, except for the last few weeks, but this is probably due to the reporting delay at the RKI. I show here in Figure 7 the total number of all hospitalizations. It is also easy to see here that in 2021, when a clear effect of the vaccinations should actually have been visible, nothing is visible at all. In weeks 26/27 the curves converge. This is an averaging artefact. For here the case numbers are close, but in every week of this summer period the hospitalizations in 2021 are significantly higher than those in 2020. Most importantly, they rise again very significantly during the summer of 2021, at a time when the vaccination rate was already well above 60%.
For those who are not familiar with these graphs, here is a simple statistical summary in Table 2 below. I have calculated the means over the year, the standard deviations and the effect size of the difference, as well as a simple statistical non-parametric comparison. The effect size d is a difference measure of the two means, standardised to the averaged standard deviation.
| 2020 | 2021 | p-value | effect size d | |
| Deaths | 830.4 (1. 260,4) | 1.402,9 (1.531,5) | <.0001 | 0.41 |
| Test-Positive | 40.491 (53.478) | 91.944 (91.056) | <.0001 | 0. 71 |
| Hospitalizations | 3,313 (3,777) | 4,486 (2,990) | <.0001 | 0. 35 |
We see: in each case, the 2021 value is statistically significantly higher than in 2020. The effect sizes are not very large, but they are significant.
Do vaccinations prevent case growth and increase in deaths in the world?
I have one final analysis to offer. It borrows from Subramanian [32]. This study found no effect of vaccination on increments of cases in the US and other countries. I have used data from the Johns Hopkins University Dashboard, kindly provided by Prof. Müller. These are case numbers, death numbers and 4-week increment numbers of these two variables, as well as the population-standardized number of vaccinations in a country for 190 countries around the world (from Afghanistan to Zambia; Germany, the USA, Uruguay and Argentina are also included). I have these numbers for both Feb. 12, 2021 and Nov 12, 2021. The data selection is random; the idea behind it: to pull the same analysis on two different cut-off dates to buffer variability due to error. Also, with two different time points, one can calculate correlations forward and backward in time.
Correlation coefficients are measures of association. They represent the relationship between two variables in a standardized way. If there is no correlation, the correlation coefficient is r = 0 or close to 0. If the correlation is perfect, the correlation is r = 1.0. If the correlation is perfectly anti-correlated, the correlation is r = -1.0. In between, correlation coefficients oscillate. In our case, we should actually see that the correlation between the number of deaths and the number of cases in a country is inversely related to the number of vaccinations, if vaccinations were to have any effect. After all, the idea is: the more vaccinations, the better, so the fewer cases and the fewer deaths. Now this is a global analysis, mind you. Countries that vaccinate less go down just as much as those that vaccinate a lot.
If you calculate the correlation on the increase in cases and deaths, that is, the difference from four weeks before, then you can see whether vaccination has an effect on this. By having the data here with an interval of 9 days, I can also calculate the correlation with the number of vaccinations at the earlier time with the numbers 9 days later, and vice versa. These time-delayed correlations are a poor substitute for causal analyses. Causality requires that the cause precedes the consequence, i.e. a higher number of vaccinations at time 1 must have a greater correlation with the number of cases (and deaths) at time 2 than a higher number of vaccinations at time 2 with the number of cases at an earlier time. Of course, this only works if there is a significant change in between. I checked this, and it is the case: the number of vaccinations changes significantly and markedly between the 9 days.
So we expect if vaccination were to have a positive effect:
- A strong negative correlation between number of population-standardised vaccinations in a country with number of cases, deaths and increments
- A significantly negative correlation between number of vaccinations at one point in time and number of cases and deaths at a later point in time
- A correlation that is significantly lower for the reverse order
None of these is the case. I present the data in Table 3. They are robust rank correlations (Spearman’s rho) and all correlation coefficients are statistically significant in the wrong direction. We see immediately: not a single correlation is negative, as would actually be expected if vaccination were showing any positive effect (i.e. the more vaccinations, the fewer deaths and cases, the less case increase). The time-forward correlation is also significantly positive and not different from the time-backward correlation. Here one would have expected at least a small difference and a negative correlation with the growth figures. None of this is visible.
| Total number of cases | Total number of deaths | Cases last 4 weeks | Deaths last 4 weeks | 4 weeks increase in cases | 4 weeks increase in deaths | |
| Contemporaneous correlation vaccination rate on 11. 12.21 | .40 | .27 | .45 | .26 | .39 | .26 |
| Simultaneous correlation vaccination rate on 2.12.21 | . 45 | .25 | .39 | .25 | .38 | .25 |
| Vaccination rate 12/21 with dates 12/11 (forward) | .44 | .25 | . 39 | .26 | .38 | .25 |
| Vaccination rate 11.12.21 with data 2.12. (backward) | .46 | .26 | .40 | .26 | .39 | .26 |
So to sum it up:
- The more vaccinations at any one time in any country in the world, the more cases and deaths are reported in that country, the more cases and deaths there have been in the last 4 weeks and the higher the increase in cases and deaths in 4 weeks.
- This shows up quite similarly at two points in time, 9 days apart
- A correlation of the vaccination rate at an earlier point in time (on Dec 2, 21) with the case numbers, death numbers and increment numbers at a point in time 9 days later is also positive, and most importantly:
- It is in no way distinguishable from a backward correlation
So the data are not nearly shaped as one would expect if the vaccination campaign had any effects.
I have to say self-critically: the time-lagged correlations cannot claim definitive significance. For that, one would have to choose much larger time intervals. I suggest that those who do not believe me or think I have made a mistake here do such an analysis, perhaps with different time intervals and time points. Furthermore, one should also not make the mistake of interpreting the positive correlation causally: Countries that vaccinate more have more deaths, perhaps because they vaccinate more. Or they vaccinate more because they have more deaths and therefore think that vaccinating more would prevent them. But we can clearly say: a statistical signal that vaccinations prevent deaths is definitely not discernible. Because then the correlation would have to be clearly negative. And it is not.
Interpretation
There are, in my view, three possible interpretations for all this data and analysis:
- Vaccination may prevent infections only in the short term. One could interpret the drop in infection numbers at the beginning of 2021 in this way, when infections were still falling in winter (Figure 6, blue curve). But the fact that they then rose again in May, when normally, in the year before for example, infections decline, does not fit into the picture. That is: their effect is very limited.
- Vaccination may only prevent the cases that are due to the virus variant for which it was originally designed. If a new one comes along, the vaccination protection is gone. The solution that a new vaccine is needed for every new variant, two to five times a year, may be a good idea for the industry that produces the substances, because it has built itself a cash machine. But it is a very bad idea for those who get the vaccines, because with each vaccination the risk of an autoimmunologically mediated derailment increases (see above).
- Vaccination may even contribute to an increase in susceptibility when a new virus variant is on the way. It may even contribute to the emergence of more aggressive viral strains through mutation, as some have speculated [28, 33, 34], because it puts more evolutionary pressure on the virus. This is because with every viral replication in an organism, there are always a few miscopies. If these are overlooked by an immune system that has been set up by vaccination to recognize viral characteristics very narrowly, then they can continue to replicate, and the vaccinated person becomes a weak excreter of a vaccine-resistant variant that can then run rampant. With natural immunity, which provides a much broader detection of viral landscapes, such a thing would not happen so easily.
- Or the vaccinations do more harm than good, or at least more than we think, because of a safety signal that is not yet recognized.
None of these four options would in itself be particularly flattering to vaccination, and it is not to say that more than one might not apply.
So, from my point of view, one must conclude from all these data and considerations:
Conclusion
There is no data base for judging vaccination to be truly beneficial. There is certainly no data base for evaluating it as truly effective in the real world. There is no data base for evaluating it as safe. And therefore there is no data basis at all for a scientifically derived vaccination obligation.
Sources and literature
- Karagiannidis C, Hermes C, Krakau M, Löffert K, Welte T, Janssen U. Versorgung der Bevölkerung in Gefahr. Deutsches Aerzteblatt. 2019;116(10):A462-6.
- Walach H. Heilung kommt von innen: Selbstverantwortung für die eigene Gesundheit übernehmen. München: Knaur Verlag; 2018.
- Moncrieff J, Gøtzsche PC, May R, Dalla-Valle G, Brown R, Dawson L, et al. Evidence does not justify mandatory vaccines – everyone should have the right to informed choice. British Medical Journal. 2021;375:n2957.
- Kmietowicz Z. Evidence is insufficient to back mandatory NHS staff vaccination, says House of Lords committee. British Medical Journal. 2021;375:n2957. doi: https://doi.org/10.1136/bmj.n2957.
- Singanayagam A, Hakki S, Dunning J, Madon KJ, Crone MA, Koycheva A, et al. Community transmission and viral load kinetics of the SARS-CoV-2 delta (B.1.617.2) variant in vaccinated and unvaccinated individuals in the UK: a prospective, longitudinal, cohort study. The Lancet Infectious Diseases. 2021. doi: https://doi.org/10.1016/S1473-3099(21)00648-4.
- Salvatore PP, Lee CC, Sleweon S, McCormick DW, Nicolae L, Knipe K, et al. Transmission potential of vaccinated and unvaccinated persons infected with the SARS-CoV-2 Delta variant in a federal prison, July—August 2021. medRxiv. 2021:2021.11.12.21265796. doi: https://doi.org/10.1101/2021.11.12.21265796.
- Mevorach D, Anis E, Cedar N, Bromberg M, Haas EJ, Nadir E, et al. Myocarditis after BNT162b2 mRNA Vaccine against Covid-19 in Israel. New England Journal of Medicine. 2021;385(23):2140-9. doi: https://doi.org/10.1056/NEJMoa2109730.
- Thacker PD. Covid-19: Researcher blows the whistle on data integrity issues in Pfizer’s vaccine trial. BMJ. 2021;375:n2635. doi: https://doi.org/10.1136/bmj.n2635.
- Doshi P. Covid-19 vaccines: In the rush for regulatory approval, do we need more data? BMJ. 2021;373:n1244. doi: https://doi.org/10.1136/bmj.n1244.
- Tanveer S, Rowhani-Farid A, Hong K, Jefferson T, Doshi P. Transparency of COVID-19 vaccine trials: decisions without data. BMJ Evidence-Based Medicine. 2021:bmjebm-2021-111735. doi: https://doi.org/10.1136/bmjebm-2021-111735.
- Lehmann KJ. Suspected cardiovascular side effects of two Covid-19 vaccines. Journal of Biology and Today’s World. 2021;10(5):1-6.
- Montgomery J, Ryan M, Engler R, Hoffman D, McClenathan B, Collins L, et al. Myocarditis Following Immunization With mRNA COVID-19 Vaccines in Members of the US Military. JAMA Cardiology. 2021;6(10):1202-6. doi: https://doi.org/10.1001/jamacardio.2021.2833.
- Gundry SR. Abstract 10712: Mrna COVID Vaccines Dramatically Increase Endothelial Inflammatory Markers and ACS Risk as Measured by the PULS Cardiac Test: a Warning. Circulation. 2021;144(Suppl_1):A10712-A. doi: https://doi.org/10.1161/circ.144.suppl_1.10712.
- Kostoff RN, Calina D, Kanduc D, Briggs MB, Vlachoyiannopoulos P, Svistunov A, et al. Why are we vaccinating children against COVID-19? . Toxicology Reports. 2021;8:1665-84. doi: https://doi.org/10.1016/j.toxrep.2021.08.010.
- Thomas SJ, Moreira ED, Kitchin N, Absalon J, Gurtman A, Lockhart S, et al. Safety and Efficacy of the BNT162b2 mRNA Covid-19 Vaccine through 6 Months. New England Journal of Medicine. 2021;385(19):1761-73. doi: https://doi.org/10.1056/NEJMoa2110345. PubMed PMID: 34525277.
- Walach H, Klement RJ, Aukema W. The Safety of COVID-19 Vaccinations — Should We Rethink the Policy? Science, Public Health Policy, and the Law. 2021;3:87-99. https://www.publichealthpolicyjournal.com/general-5
- Rose J. A report on the U.S. vaccine adverse events reporting system (VAERS) on the Covid-19 messenger ribonucleic acid (mRNA) biologicals. Science, Public Health Policy, and the Law. 2021;2:59-80.
- Pfizer Inc. mRNA vaccine against Covid-19 – Submission for regulatory approval in Japan. 2020.
- Li C, Chen Y, Zhao Y, Lung DC, Ye Z, Song W, et al. Intravenous Injection of Coronavirus Disease 2019 (COVID-19) mRNA Vaccine Can Induce Acute Myopericarditis in Mouse Model. Clinical Infectious Diseases. 2021. doi: https://doi.org/10.1093/cid/ciab707.
- Jiang H, Mei Y-F. SARS-CoV-2 Spike Impairs DNA Damage Repair and Inhibits V(D)J Recombination In Vitro. Viruses. 2021;13(10):2056. doi: https://doi.org/10.3390/v13102056. PubMed PMID: 34696485.
- Topol EJ. Rofecoxib, Merck, and the FDA. New England Journal of Medicine. 2005;351:2875-8.
- Topol EJ. Failing the public health – rofecoxib, Merck, and the FDA. New England Journal of Medicine. 2004;351:1707-9.
- Nordström P, Ballin M, Nordström A. Effectiveness of Covid-19 Vaccination Against Risk of Symptomatic Infection, Hospitalization, and Death Up to 9 Months: A Swedish Total-Population Cohort Study. SSRN. 2021. doi: https://doi.org/10.2139/ssrn.3949410
- Rommel A, von der Lippe E, Plaß D, Ziese T, Diercke M, an der Heiden M, et al. The COVID-19 Disease Burden in Germany in 2020. Deutsches Ärzteblatt International. 2021;118(9):145-51. doi: https://doi.org/10.3238/arztebl.m2021.0147.
- Everts J. The dashboard pandemic. Dialogues in Human Geography. 2020;10(2):260-4. doi: https://doi.org/10.1177/2043820620935355.
- Kuhbandner C, Homburg S, Walach H, Hockertz S. Was Germany’s Lockdown in Spring 2020 Necessary? How bad data quality can turn a simulation into a dissimulation that shapes the future. Futures. 2022;135:102879. doi: https://doi.org/10.1016/j.futures.2021.102879.
- Dehning J, Zierenberg J, Spitzner FP, Wibral M, Neto JP, Wilczek M, et al. Inferring change points in the spread of COVID-19 reveals the effectiveness of interventions. Science. 2020;369(6500):eabb9789. doi: https://doi.org/10.1126/science.abb9789.
- Sagripanti J-L, Aquilano DR. Progression of COVID-19 under the highly restrictive measures imposed in Argentina. Journal of Public Health Research. 2021. doi: https://doi.org/10.4081/jphr.2021.2490.
- Bendavid E, Oh C, Bhattacharya J, Ioannidis JPA. Assessing Mandatory Stay-at-Home and Business Closure Effects on the Spread of COVID-19. European Journal of Clinical Investigation. 2021:e13484. doi: https://doi.org/10.1111/eci.13484.
- De Larochelambert Q, Marc A, Antero J, Le Bourg E, Toussaint J-F. Covid-19 Mortality: A Matter of Vulnerability Among Nations Facing Limited Margins of Adaptation. Frontiers in Public Health. 2020;8(782). doi: https://doi.org/10.3389/fpubh.2020.604339.
- Donzelli A, Alessandria M, Orlando L. Comparison of hospitalizations and deaths from COVID-19 2021 versus 2020 in Italy: surprises and implications [version 1; peer review: awaiting peer review]. F1000Research. 2021;10(964). doi: https://doi.org/10.12688/f1000research.73132.1.
- Subramanian SV, Kumar A. Increases in COVID-19 are unrelated to levels of vaccination across 68 countries and 2947 counties in the United States. European Journal of Epidemiology. 2021. doi: https://doi.org/10.1007/s10654-021-00808-7.
- Riemersma KK, Grogan BE, Kita-Yarbro A, Halfmann PJ, Segaloff HE, Kocharian A, et al. Shedding of Infectious SARS-CoV-2 Despite Vaccination. medRxiv. 2021:2021.07.31.21261387. doi: https://doi.org/10.1101/2021.07.31.21261387.
- Read AF, Baigent SJ, Powers C, Kgosana LB, Blackwell L, Smith LP, et al. Imperfect Vaccination Can Enhance the Transmission of Highly Virulent Pathogens. PLOS Biology. 2015;13(7):e1002198. doi: https://doi.org/10.1371/journal.pbio.1002198.