… As New Study Shows
Ladies and gentlemen from the executive and legislative branches: it’s time for you to apologize to the citizens
I’m tired of it, but the political inertia of the executive and legislative branches leaves me no choice but to keep repeating my “ceterum censeo”: The corona crisis was home-made and the “measures”, fondly referred to as “lockdown”, were ineffective, just like the genetic engineering prevention measures, euphemistically referred to as “vaccinations”. Unlike the classic historical “ceterum censeo – furthermore, …” of old Cato, mine is not aimed at the destruction of anything – in Cato’s case it was the destruction of Carthage – but at finally having an open political discourse about what happened. And there are many reasons for this, which I have described in my blogs. Today I am describing a new one:
A very nice study by an international team of authors [1], which analyzed data for the six northern European countries Ireland, England, Denmark, Sweden, Norway and Finland, shows:
The “measures”, correctly the “non-pharmacological interventions (NPIs)”, and the “vaccinations” have shown no discernible impact on case numbers, deaths, hospital and intensive care unit occupancy in the data.
There is not even a glimmer of hope in the data to read any positive influence of NPIs and “vaccinations”, on the contrary. The only thing that “explains” the course of the data in terms of a scientific explanation of variance is the seasonality of beta coronavirus diseases, measured by the weekly data of such infections from 2010 to 2020 (!) in Stockholm, i.e. in the 10 years before the pandemic. Hence, the title “Influence of Seasonality and Public-Health Interventions on the Covid-19 Pandemic in Northern Europe“. I would like to explain this in more detail below.
It is wise that the authors chose these 6 countries because they have reacted very differently to the pandemic and have also registered very different courses in terms of the number of cases and victims. It was tempting to link this to the different strict political reactions through bans and other NPIs, and German journalism spent weeks working itself up on the supposed culprit, Sweden.
The authors use publicly available data and bring the so-called “stringency index”, which a working group from Oxford had updated weekly for each country [2] in connection with the key figures they had extracted to characterize the progression of the Covid-19 pandemic (I know, I should say SARS-CoV-2 pandemic, but I won’t here for the sake of simplicity): Case numbers, Covid-19 deaths, deaths time-lagged by 3 weeks, positivity rates (i.e. percent of those testing positive compared to the number of all those tested), hospitalization rates and ICU bed occupancy. All these data are of course standardized to 100,000 people so that they are comparable across countries. For the further presentation in the publication, the authors use the series of deaths, which is delayed by 3 weeks, because their data showed that in the first wave the interval from peak infection to peak death is 3 weeks. The other data are shown in the supplement.
The ineffectiveness of NPIs
The progression of NPIs and deaths can initially be visualized in a simple descriptive way and then looks like this (Fig. 1):
You can see even without formal statistical analysis: The peaks of the NPIs are always after the peaks of the deaths. The very last peaks of the blue curves for Finland, Norway and Denmark are an exception.
Firstly, you can see that the NPIs in England, Ireland and Norway were relatively high in the first year of the pandemic in 2020, almost at 80 (out of a possible 100 percentage points). Only Argentina reached these 100 points for a longer period of time (and did very badly with them, as Sagripanti [3] has shown). The much-maligned Sweden also had a relatively high Stringency Index from March 2020 to March 2021. This index included all possible political measures that countries were able to enact, such as school closures, store closures, border and curfew closures, assembly bans, etc., on a weekly basis.
In order to clarify whether there was an impact or not, the authors applied a clever analysis that I will briefly explain, namely a time-lagged correlation between the intensity of the policy measures (measured with the Stringency Index) and the course of the Covid-19 pandemic (measured by deaths, but also by the other parameters mentioned above; these data are presented in the Supplement and behave similarly). Normally, correlations are always calculated simultaneously. A correlation between the stringency index and the number of deaths provides information on how high the correlation is, if there is one, measured at the same point in time. You can now calculate the stringency index at a certain point in time with the deaths one, two or more weeks later. This is a “positive lag”, a positive delay. You can also compare the number of deaths today with the stringency index a few weeks earlier. The idea behind this is that if one variable, here the stringency index, has a causal effect on another, i.e. the deaths (because it is supposed to prevent such deaths, or cases of illness, or intensive care bed occupancy), this correlation should become negative and significant with a lag, whereas it should not show such a relationship when correlated with past values. If a lagged correlation into the future becomes negative, this means that the policy intervention at a certain point in time is negatively related to deaths later and has thus contributed to their reduction. Because this correlation is delayed in time, one could ideally also say something about causality, because the cause normally precedes the effect.
And that is precisely not the case. For some countries, there are small and significant time-delayed negative correlations between cases and deaths. But because there are also a few positive time-lagged correlations and because the negative correlations already existed before the intervention, we can at best conclude from the data (see Figure 4 in the original publication):
There is no evidence that the NPIs have reduced cases and deaths.
Rather, it seems that the NPIs were political reactions to the increase in cases and deaths. We also found this correlation in our own modeling study [4].
The ineffectiveness of “vaccinations”
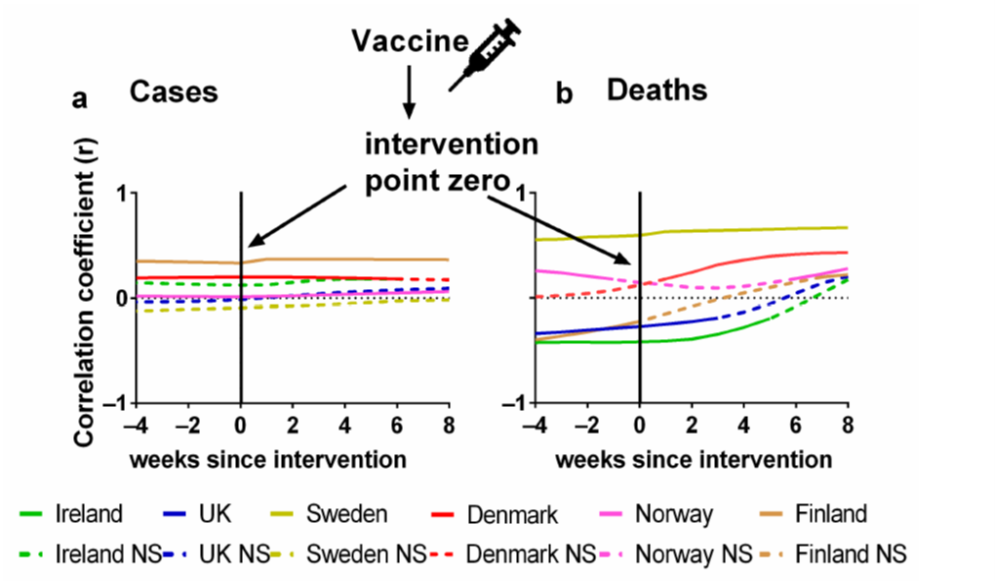
The authors chose the same approach for the Covid-19 “vaccinations”. I present the result in Figure 2:
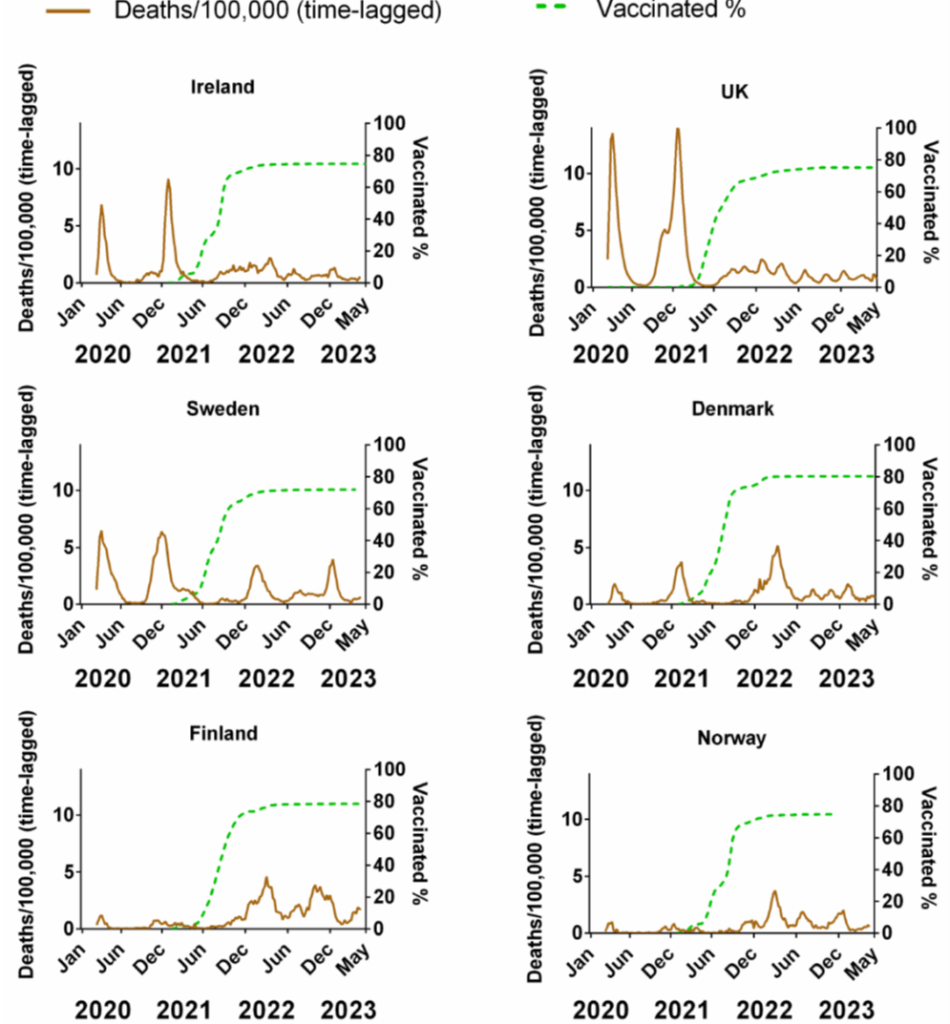
Firstly, you can see that the mortality rate in the six countries was very different. While it was initially below or around 1 death per 100,000 inhabitants in Norway, Finland and Denmark, it peaked at 12 in England and was in between in Sweden and Ireland. For Ireland and England, deaths after “vaccination” were significantly lower, for Sweden slightly lower. But here, too, deaths did not simply disappear, but were lower, while for Denmark, Finland and Norway they actually increased after the vaccination campaign.
The time-shifted correlations show no positive effect of the “vaccination”. Here one would expect a clearly negative correlation between “vaccination” and cases or deaths for the time-shifted correlations, i.e. a vaccination today and the number of cases or deaths one to several weeks later. This is precisely not the case; on the contrary, these relationships are even positive and significant for some countries. This can be seen in Figure 3:

Of particular concern is the fact that some correlations are negative before the time of intervention and become positive afterward. In any case, no effect of “vaccination” on case numbers or mortality rates can be maintained on the basis of these data. If they do, then these “vaccinations” at best make the number of deaths worse.
The study concludes with a very interesting analysis. The authors use a completely different data series. Namely, the course of beta corona infections in the Stockholm area from 2010 to 2020. Coronaviruses are well-known and occur again and again, every year, cyclically. The authors map this cyclicality with the mean value of this 10-year series. And lo and behold: both in the time-shifted correlation and in a multivariate regression analysis, it turns out that this cyclicality reflects the events well. In a regression analysis, this cyclic is the main explanatory variable.
This means that what we have seen in the course of the corona pandemic was above all a well-known cyclical infection pattern, as is very well known from other corona infection epidemics. This cyclicality is related to temperature events, solar radiation, susceptibility of the human host, behaviors, resistance, etc. It is not related to the NPIs. It is not related to the NPIs, nor to any “vaccinations”.
Phrased another way. Vaccinations and political public health measures had no influence on the course of the Covid-19 pandemic. Not the slightest, at most, vaccinations have increased the number of deaths.
Of course, this can only be deduced directly from the study for these 6 northern European countries. But it would be very surprising if it were different elsewhere.
The authors discuss their findings in detail. After all, other studies had used large-scale modeling to claim that vaccinations had saved millions of lives. We have shown before, that these studies were poor and operated with false data [5]. The original study is so wrong that I don’t even do it the honor of quoting it. The same applies to the Priesemann study, which was highly praised in Germany. It was also based on false data, and we soon showed this and subsequently published it [6]. Unfortunately, only what suits the government narrative was and is quoted in the media.
So the study by Quinn and colleagues joins a growing number of studies that prove the government narrative wrong with clear data and statements. In my view, it is now time for those in power, i.e. the executive, and those who have allowed it to operate unchecked, the legislature, to apologize to the citizens and at least allow a political discourse, preferably initiate one, on how this breakthrough into a quasi-totalitarian regime could have come about. We are quick on the draw when we think we have to identify and denounce totalitarian practices in other countries, and very slow when it comes to denouncing such structures in our own country. After all, we are the good guys, aren’t we? Well, apparently less than we think.
Sources and literature
- Quinn GA, Connolly M, Fenton NE, Hatfill SJ, Hynds P, ÓhAiseadha C, et al. Influence of Seasonality and Public-Health Interventions on the COVID-19 Pandemic in Northern Europe. Journal of clinical medicine. 2024;13(2):334. PubMed PMID: doi: https://doi.org/10.3390/jcm13020334.
- Hale T, Angrist N, Goldszmidt R, Kira B, Petherick A, Phillips T, et al. A global panel database of pandemic policies (Oxford COVID-19 Government Response Tracker). Nature Human Behaviour. 2021. doi: https://doi.org/10.1038/s41562-021-01079-8.
- Sagripanti J-L, Aquilano DR. Progression of COVID-19 under the highly restrictive measures imposed in Argentina. Journal of Public Health Research. 2021. doi: https://doi.org/10.4081/jphr.2021.2490.
- Klement RJ, Walach H. Identifying factors associated with Covid-19 related deaths during the first wave of the pandemic in Europe. Frontiers in Public Health. 2022;6th July 2022. doi: https://doi.org/10.3389/fpubh.2022.922230.
- Klement RJ, Walach H. SEIR models in the light of Critical Realism – a critique of exaggerated claims about the effectiveness of Covid 19 vaccinations. Futures. 2023:103119. doi: https://doi.org/10.1016/j.futures.2023.103119.
- Kuhbandner C, Homburg S, Walach H, Hockertz S. Was Germany’s Lockdown in Spring 2020 Necessary? How bad data quality can turn a simulation into a dissimulation that shapes the future. Futures. 2022;135:102879. doi: https://doi.org/10.1016/j.futures.2021.102879.