
Why official expectations and facts are so different, with fatal consequences for all
One of the contradictions in the whole Corona pandemic is the obviously drastic-high death rate at the beginning in China triggered by the SARS-CoV-2 outbreak and the comparatively harmless situation here. What happened in China produced panicky predictions in the early modellers. These, in turn, were wrong by orders of magnitude, and none of these drastic predictions came true. Why? The well-behaved schoolboy answer to this question is: Yes, because we took drastic action like lockdowns and so on. This answer is wrong, as I have discussed many times before. So why the contradiction? In this post, I will shed light on these two aspects. That there were drastic events in China is shown by the careful research of Sharry Markson in her book “What really happened in Wuhan”. That there was no extraordinary excess mortality in our country is shown by a new, very careful analysis by Rockenfeller and colleagues from Germany.
Sharry Markson – What really happened in Wuhan
In the beginning, I thought like many colleagues I know: maybe the reports from China were wrong or exaggerated. Since I read Sharry Markson’s book, I disagree [1]. A careful review is not my aim here. But this much can be said: the book is perhaps one of the best journalistic books I have read on the subject. Sharry Markson is an Australian journalist who has talked extensively to Chinese whistleblowers, to US politicians and to intelligence people from different services, and in this book she sets out her findings in an extremely exciting way – a thriller could hardly be more exciting and is more often worse written than this book.
Their findings in brief: The virus almost certainly broke out in Wuhan as early as October 2019, presumably just before or while the World Military Olympics were taking place there. This is a regularly occurring sporting event involving athletes from all the world’s armies, and was precisely planned well in advance to take place in Wuhan in October 2019. In Wuhan and shortly afterwards elsewhere in China, the outbreak caused great panic because many people became seriously ill and died. The authorities probably tried to hide the outbreak for a long time. Markson also mentions something that struck me very early on: although the authorities there were well aware of the seriousness of the situation, they did next to nothing at first to contain the spread. The airports remained open, all international hubs were always open [2]. And Wuhan airport was closed only after the Spring Festival in January [3]. Certainly the wrong strategy if you want to contain a novel pathogen. Only through spectacular actions by doctors and civilians did the authorities then take action and try to cover up as much as possible.
All this, and a great deal more circumstantial evidence, suggests, says Markson, that the intention here was to cover up a highly embarrassing accident at Wuhan’s Institute of Virology (WIV) or at the neighbouring Institute of Biological Products, a military research establishment.
Sharry Markson says the Chinese authorities tried to conceal the extent of the real tragedy. Whether this was deliberate or incompetent, she doesn’t say much about that. The elaborated attempts by an internationally renowned group of virologists to ban discussion of a possible laboratory accident by ordre de mufti as early as February 2020 [4] worked quite well for a while, at least as far as public discourse was concerned. But the truth can hardly be concealed forever. And so Markson also cites a whole series of findings, including interviews and statements by high-profile experts.
These findings support what German researchers had also said early on, but which was obediently branded a “conspiracy theory” by all mainstream media: There is much more evidence to suggest that the virus originates from “gain-of-function” research, i.e. laboratory experiments that attempt to give natural viruses new properties that make them more infectious and dangerous to humans. This research is of course military in nature and stems from always trying to get ahead of possible “bioterrorists” in order to understand how possible bioweapons might work and how to protect against them, for example through vaccination. The fact that those who conduct such research are essentially becoming bioterrorists themselves escapes most of those involved in it.
A small detail on the side – of which there are many in Markson’s book: Shi Zhengli, the head of the Wuhan lab, and Peter Daszak, the head of the US Eco-Health Alliance, which collected money for research in Wuhan from the NIH and other US funders and channelled the money there, had applied to the US military’s research arm, DARPA (Defence Advanced Research Projects Agency) a few years earlier. The application money was to be used to engineer bat coronaviruses to have a so-called furin cleavage site on the spike protein responsible for contacting the ACE receptor. This furin cleavage site would allow the bat coronavirus to infect human cells, according to the proposal. It was rejected. But the content of the motion has a lot of similarity with what then happened: a beta coronavirus with a furin cleavage site on the spike protein acquires the ability to infect human cells precisely through this. To this end, it is important to know: None of the known bat viruses have this furin cleavage site. Furin is an enzyme that occurs primarily in humans, but also in other warm-blooded animals. Only through this enzymatic activation can the virus enter the human organism. It is also conceivable that the virus would have acquired this property in a double infection with a host, in which a coronavirus without a furin cleavage site and another virus with a furin cleavage site would have recombined by chance and then left this host again as a hybrid produced by nature, so to speak. However, this is contradicted by the fact that such a hybrid has not been found in any host, although it has been searched for in over 80,000 different samples. Therefore, another group of respected virologists argues against the ban on thinking and talking and pleads for keeping the discussion open [5]. After all, that such a combination arose by chance is very unlikely [6].
Lab virus
A paper just deposited on the preprint server BioRxiv argues that there are fingerprints in the SARS-CoV-2 virus that suggest a laboratory origin [7]. This is because the artificial assembly of viruses apparently uses individual modules that are put together by certain enzymes. This is clearly the case with this virus. In general, the thesis of the artificial origin of SARS-CoV-2 seems to be slowly becoming debatable. The purveyors of discourse around Andersen [8], to whom Drosten also belonged [4], have still managed to make this thesis taboo for almost two years, though. Gøtzsche has called this “science by eminence” [9]. The expert interviews I conducted also suggest that the virus originated in the laboratory rather than in nature, because it was perfectly adapted to humans from the start. To do this, viruses that come directly from nature first need a certain adaptation period, and this allows the original animal host to be tracked down. In the case of MERS, it took less than three months, and then it was known that it came from the camel and, conversely, camels could be re-infected. This is exactly what failed with SARS-CoV-2. They couldn’t find an intermediate host, and they couldn’t reinfect bats. All this, and a few more good arguments that Sharry Markson lists, argue for a laboratory origin.
It was an accident that must have happened sometime in the first two weeks of October 2019 in Wuhan. Markson sees this in the fact that, first, the lab there was shut down. You can see that in a drastic reduction in mobile phone signals around and from the lab. The second indication is that there was a sudden investment in enormous security measures. Third, the database that contained the virus information went offline. Fourth, the information Shi Zhengli gave that this was because of hackers was wrong; because the internet traffic just before that showed little outside access that would suggest hacking.
So we are looking at a lab accident that happened in one of the few high security labs in China – which again was not as secure as it should have been. This accident involves the circulation of a virus that has been deliberately engineered to dock with human ACE2 receptors. These are everywhere, in the lungs, in the blood vessels, and when infection takes place and becomes systemic, it leads to severe atypical pneumonia. The Chinese authorities were quietly running amok while trying to signal normal business to the outside world. That tragic situations have arguably occurred in China is well indicated by Markson’s research.
The paradox: China’s panic is infecting the rest of the world, but there is actually little reason for this
Now comes the paradox that concerns me: Why did what apparently happened in China, and which everyone was afraid of, not happen here? Why was the killer virus narrative obviously wrong relatively early on? I will refer to a new study below that proves this absolutely watertight. In Europe and the rest of the world, this SARS-CoV-2 pandemic has turned out comparatively mildly. Many deaths are attributed to this pandemic, but a great many are probably not due to the virus itself, but to the reactions to it. And hence the paradox arises: why did we not experience the drama?
There are several ways of understanding this. One I had already hinted at in my last blog: the virus has a particular affinity for Asian people and affects different populations differently. Some reviews I already cited in my last blog point in this direction [10-12]. While they do not signal watertight evidence, they at least make it plausible that there are various aspects that allow us to understand different susceptibility of different ethnic groups and populations at the genetic level. For example, people with the Human Leukocyte Antigen (HLA) with its genetic variant B*46.01 have the lowest binding density for SARS-CoV-2 [13]. And this variant is most common in East Asia, China, Thailand, Vietnam [12]. This HLA is part of the Major Histocompatibility Complex (MHC), the receptor that signals immune cells that a cell is the body’s own. Activation via HLA is part of the natural immune response to viral invaders, especially in the case of SARS-CoV-2 [14]. Therefore, it is at least likely that such genetic variability explains differences in susceptibility, especially since the different HLA genotypes represent only one of many genetic variants that can explain different responses.
An alternative explanation is: Since the virus broke out considerably earlier than expected, it probably had enough time to do what viruses normally do, namely to adapt more to its host through evolution so that it does not kill it immediately. As a result, it becomes less dangerous. Whether the three months between the presumed first outbreak and the jump to Europe and the USA are enough to justify a reduction in danger is something specialists will have to say.
That still doesn’t explain why the Chinese, in one of the few specialized laboratories they have that is under the control of the military, are researching, of all things, a virus that tends to be more dangerous to their own population than to the rest of the world. I asked one of my interview partners who has done research for the US military for a long time, but also for NIH and FDA. He said: The Chinese didn’t realize it because they’re just not good enough at understanding what they’re doing. Or they knew, and they were doing research on a special vaccine because they were worried that such a virus could be used as a bioweapon against them, and in the process an accident occurred.
After all, they did the research together with Daszak’s EcoHealthAlliance (which paid for it) – the very Daszak who was sent to Wuhan by the WHO to investigate the Lab Leak thesis [1, 9]. This is indeed a bit like having hired Al Capone in the 1920s to find out if there was illegal whisky smuggling from Canada to the USA. Illegal whisky? Nope, never heard of it… Virus from this lab? Nope, can’t be… But through this sponsoring, the US sponsors of course knew perfectly well about what was happening in Wuhan. It was happening on their behalf, after all. And then, of course, the Chinese also knew, as long as they had been paying close enough attention, what was being tinkered with. And of course they could always state, that they were doing precautionary research, vaccination research, etc.
This differential danger of this SARS-CoV-2 virus for different ethnic groups now explains two things: why this bottomless chaos broke out in China, which infected the rest of the world as a psychological infection, and why this was essentially a false alarm in our country.
The Evidence for the False Alarm – The New Excess Death Calculations by Rockenfeller, Günther and Mörl)
https://doi.org/10.1101/2022.11.18.22282534
To be clear: I do not mean to signal by “false alarm” that the SARS-CoV-2 virus did not exist, nor that it did not lead to severe courses of the disease in some. I am signalling: The panic that was spread, and in some cases is still being spread, and the exaggerated political measures were unfounded. This assessment is, incidentally, increasingly widely shared, e.g. here by the Australian pathologist Clancy.
But ultimately, it is the bare numbers that are the issue. We have heard horrendous figures from the RKI and the WHO about the number of COVID-19 victims. 200,000 deaths in 2020 and 2021, said the WHO, more than 80,000 from May 2020 to May 2021, said the RKI. That would be a lot of deaths indeed, well above the 25,000 deaths usually estimated as a result of influenza illness during more severe influenza waves.
Rockenfeller and colleagues have now made a careful calculation in their paper, which they recently deposited on the preprint server MedRxiv [15]. The three authors are mathematicians, physicists and life scientists and are excellent with numbers. All other published analyses that make any statements about excess deaths have mostly looked at very short periods of time. Rokenfeller and colleagues took the daily and weekly deaths with all causes of death for Germany, from the year 2000 to 2021, so they calculated with mortality data of 20 years before they made any statements about expected deaths during the corona phase and derived models for prediction from these 20 years.
And, this is extremely important, they did this for different age cohorts. I am reproducing the curve of weekly General Mortality Rates per age cohort as it appears in the original publication. This is the number of people who died in an age cohort, calculated on the total number in a cohort.
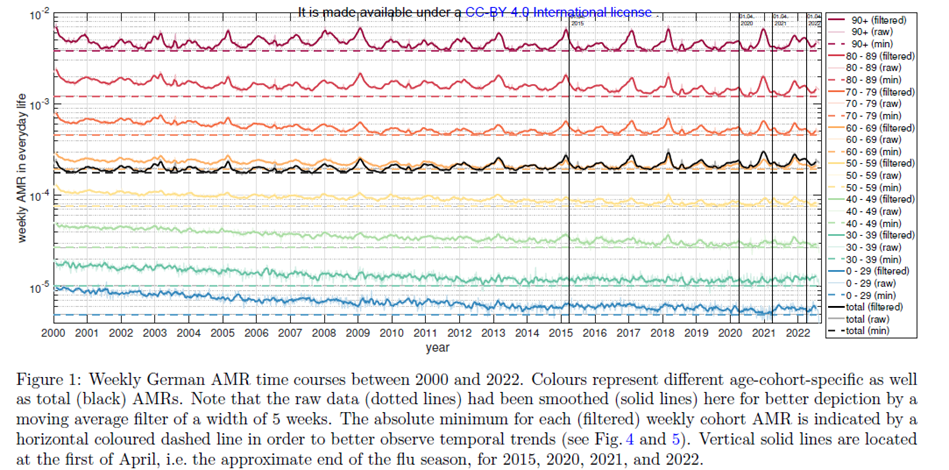
If you want to study the figure in more detail, you should view it in the original; there you can enlarge it. The figure gives mortality rates in age cohorts. The first goes from 0 to 29 years, after which the cohorts are divided into groups of ten years. The black line in the middle shows the averaged trend. The curves are smoothed, and the lower dotted line reflects the minimum value in an age cohort in each case.
What stands out? Well, first of all, there is a downward trend in all age cohorts over the 20 years of observation: mortality rates are decreasing, and they are decreasing in all age groups except the oldest, where they remain reasonably constant. Especially among the younger age cohorts, mortality rates decrease sharply.
The vertical lines mark April 1, the end of the flu seasons in 2015, 2020, 2021 and 2022. If we look at the peaks, which are particularly pronounced in the older cohorts, which are strong around the turn of each year just until the start of spring, we see that they are present every year, sometimes stronger, sometimes weaker. They were particularly strong in the older cohorts in 2000, 2005, 2009, 2015, 2017, 2018. What is also noticeable is that the years after a strong peak are usually followed by ones with a weaker peak. These mountains are the winter cold or flu waves (flu waves is actually wrong, I think, because sometimes it is really flu viruses, sometimes it is rhino viruses, parainfluenza, syncytial viruses, or even coronaviruses that are rampant and take the lives of the elders). And in these waves, it is mainly the most susceptible who die, namely the elders and the elderly. And when the most susceptible have died, there are one or two years with less deaths until a larger group of susceptible people has grown old again. At some point, we will all belong to this group of susceptibles, who will possibly die of an infection, if they have not died of something else before.
What we also see: The arrival of the supposed killer virus SARS-CoV-2 in Germany at the beginning of 2020 in no way triggered a major mortality wave. This came belatedly towards the end of 2021, but was then also no bigger than the larger flu waves of the years before. This is also visible to the naked eye. And even towards the end of 2022 there was no sign of dramatic excess mortality. So actually: normal living and dying as always, one might think.
Now, one can summarise these annual mortality rates into one-year values. This is what the authors did in a figure that I reproduce as Figure 2, Figure 2a in the original.
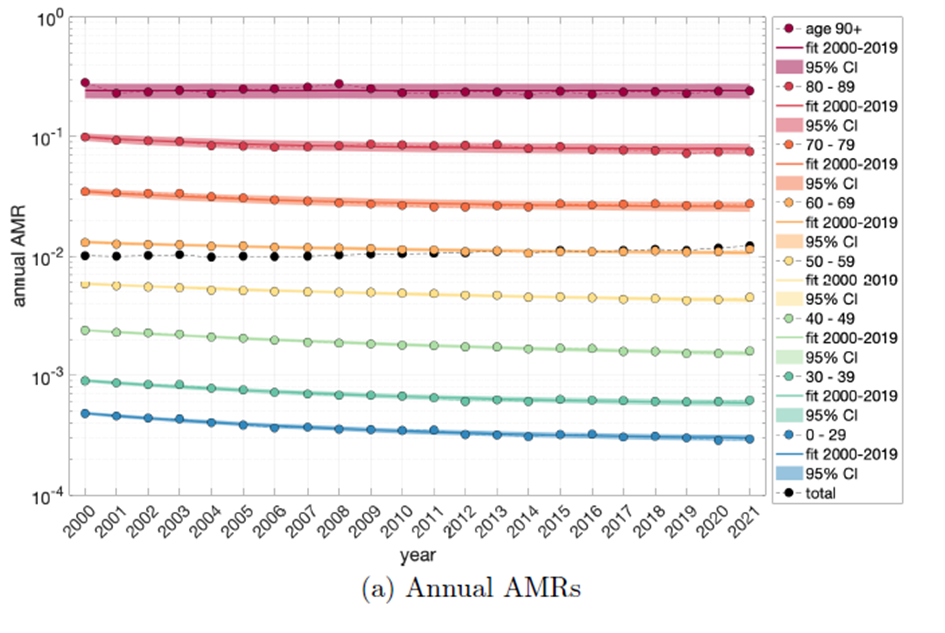
You can see very clearly: mortality rates are going down, especially in the younger cohorts, in the oldest they remain stable, but paradoxically they are going up overall (the black curve partly overlaid by the orange one). From this, we can see that the resolution of these data by age cohorts and age standardization are central. For this is where what is known in statistics as Simpson’s Paradox strikes: namely, that a finding can be different for subgroups than for the whole group, and that is when the group size is very different and when the variable of interest, in this case mortality, affects the groups differently.
This is because the composition of age cohorts has changed over the decades. The population got older, the younger people became proportionately less or aged, so that the trend – mortality decreasing – that is visible in the younger ones, no longer prevails in the overall mortality.
If you don’t take age cohorts into account, and especially if you only choose a short comparison period, you go astray. This also explains why models such as those calculated for WHO, which only took into account a 5-year period in the past, or EUROMOMO, for example, fall short, in the truest sense of the word.
The authors then used the data series of the last 20 years to find a statistical model that reproduces these data series sufficiently well (I discussed this briefly in my methods blog on models: https://harald-walach.info/25-models-and-causality/). They have calculated two models for this, one is more complex because it is an exponential model, another simply assumes constant change. Both models explain the trajectories quite well (Fig. 3):

What is immediately noticeable: the models both fit quite well, the blue, linear one because it only takes the part of the curve that is linear, the green, non-linear-exponential one because it is obviously a good fit for the overall curve. What you can also see: The WHO model is useless because it predicts completely wrong numbers for 2020 and 2021 that have nothing to do with reality. Levitt and colleagues have recently shown how differently different models predict in two papers [16, 17].
Now, if you take such erroneous predictions, subtract the real data from them, and interpret the difference as Covid-19 mortality, as the WHO study modellers did, you of course end up with horrendous numbers, but not because COVID-19 was so catastrophic, but because the model was so bad.
Covid-19 mortality in the study by Rockenfeller and colleagues
The authors can now use the two mathematical models to calculate, in the last two years (2021 and 2022), what the excess mortality is or what the expected mortality should be. If you subtract these figures from the reported figures, which are only available up to 2021, you get the excess mortality or under-mortality, i.e. the number of deaths that are higher or lower than should be statistically expected. For 2022, this is purely an estimate. They also compare it with the estimated flu deaths provided by the RKI for the different flu years from 2001 to 2018.
You can see from these calculations that for the major earlier flu waves, the models agree relatively well with the RKI’s estimates of flu deaths. You can also see that 2020, which was actually the “annus horribilis”, the scare year, the first pandemic year when the killer supposedly swept across the country, showed a significant under-mortality of -14,000 to -18,000 (linear or non-linear model). The years 2021 and 2022 then show excess mortality totalling about 12,000 to 14,000 deaths. Looking at the seasonal plot, each including only 33 weeks of cold waves from autumn to spring (Table 2 in the original text), we see that the 2018/19 and 2019/20 flu seasons each showed strong under-mortality of just over -22,000 deaths, which were then offset by the two stronger waves in 2020/21 and 2021/22 with over-mortality of 27,000 and 30,000, respectively, showing the second and subsequent Corona waves.
Overlooking the whole series, however, we see that these excess mortalities from the Corona years were only marginally higher than those from the severe flu years in the last 20 years. So the Corona pandemic years were not that exceptional if you look at the pure excess mortality calculation. The differences with other models, as I said, come from the fact that all the other models used much shorter time periods and therefore much poorer data for modelling.
The authors then estimate how many people died from Covid-19 and come up with about 57,000 deaths for 2020 and 2021, which is about half less than the nearly 115,000 deaths estimated by the RKI and significantly less than the nearly 200,000 deaths estimated by the WHO model. They discuss the reasons for these discrepancies. They lie in the fact that the data basis of the other models was poorer and, above all, that the models were more complex. Due to the long data series, their model is much more stable.
If you compare the PCR-defined Covid-19 deaths that were reported with those that resulted from this excess mortality calculation, you can see that they are very close. From this, one can conclude: most of the people who are listed as Corona deaths in the statistics would have died of whatever in the near future anyway. To put it another way, there is no signature in the data for a pandemic event that would have generated extraordinarily strong extra mortality. Now, this does not mean that there were no corona waves. But it does mean that only in very rare cases did these corona waves took people who would not otherwise have died from something else. That’s because most of the deaths were in the older age cohorts.
To put it another way, there were deaths declared as Covid-19 deaths by the PCR tests that might otherwise have been reported as having died of other causes.
So, at least for Germany, no drastic event can be recorded that would have justified a state of emergency.
So where is the panic coming from?
Rockenfeller, Günther and Mörl actually did the work that our federal authorities, the Federal Statistical Office or the RKI, should have done: a solid estimate of a mortality curve over 20 years, derive a model from it and then calculate how high the deviation from the expectation is. If this had been done right at the beginning of 2020, it would have become clear immediately: no need to get excited. Large federal authorities would actually have the staffing and also the task to do this. Why this did not happen will remain the secret of politics, unless it is clarified by a careful parliamentary investigation. But you can see from this example that this task is not witchcraft. If three scientists, who actually have other things to do, can manage to do this in their spare time, so to speak, and do it better than anything authorities have delivered so far, then authorities could easily have done it within a few weeks.
So either it was not the aim of the policy to send a relaxing message, or no one thought of carefully examining the mortality data of past years. Both are unflattering to our leadership. Why was this so? Because everyone was hypnotized by the reports from China and later from northern Italy? Because we humans suffer from confirmation bias? We have an opinion or a suspicion and then try to confirm it by any means necessary, the typical mistake of bad detective detectives in even worse TV thrillers.
Most contemporaries make the mistake of thinking that because things were bad in China, they couldn’t have been any different elsewhere. As my reflections at the beginning of this text show, it is quite conceivable that we were dealing with a virus that had characteristics that were particularly dangerous to people from Southeast Asia, or whose dangerousness changed very rapidly through mutation. In any case, the great excitement was not justified. That it was not the government’s quick reaction that prevented a catastrophe is something I have discussed several times. We have refuted that in a recent publication [18]. You can also see this in Levitt’s comparison of countries: countries without strong “measures”, such as Sweden or Finland, have significantly lower excess mortality than some with such measures [16].
How is it then that in the USA, for example, excess mortality is particularly high? One has to remember that the Non Pharmacological Interventions (NPIs), “interventions” that is, contrary to what most think, may not only have saved lives but may have cost many victims themselves. Because they often led to even greater poverty, especially among the poorest. Because of the lack of medical care, important interventions or operations were not carried out. Through mental stress to an increase in mental disorders and associated morbidity and mortality. Through the increase in unemployment and the disruption of social relationships, which also lead to a greater burden. And there are probably a number of further factors at work here.
What you can also see from this data: The supposed salvation provided by vaccination is an illusion. The excess mortalities of 2021 and 2022 are higher than those of 2020. These could be natural trends for which one does not have to apply any particular causality at all, except for the fact that it is precisely those who did not die the year before but who are coming of age who keep dying. But it could also be that this shows the multiple sensitivity that doctors observe in people who have been vaccinated several times. In any case, it is an illusion to say that vaccination saved lives. If it had, we would not have seen higher excess mortality in 2021 and 2022, especially since, according to all evolutionary logic and observations, the new virus variants have become more infectious but less dangerous.
So we’ve fallen for an old trick that stage magicians also often use: You show a series of something and the audience expects something analogous and sees not what is there but what they expect. In this case, it was pandemic chaos. The only chaos that really occurred was the one we made ourselves. It is time for politicians and especially the press and media world, who have helped fuel this narrative, to own up to it and come to terms with it.
Sources and literature
- Markson S. What really happened in Wuhan. Sydney: Harper Collins; 2022.
- Chinazzi M, Davis JT, Ajelli M, Gioannini C, Litvinova M, Merler S, et al. The effect of travel restrictions on the spread of the 2019 novel coronavirus (COVID-19) outbreak. Science. 2020:eaba9757. doi: https://doi.org/10.1126/science.aba9757.
- Pan A, Liu L, Wang C, Guo H, Hao X, Wang Q, et al. Association of Public Health Interventions With the Epidemiology of the COVID-19 Outbreak in Wuhan, China. JAMA. 2020;online first. doi: https://doi.org/10.1001/jama.2020.6130.
- Calisher C, Carroll D, Colwell R, Corley RB, Daszak P, Drosten C, et al. Statement in support of the scientists, public health professionals, and medical professionals of China combatting COVID-19. The Lancet. 2020;395(10226):e42-e3. doi: https://doi.org/10.1016/S0140-6736(20)30418-9.
- van Helden J, Butler CD, Achaz G, Canard B, Casane D, Claverie JM, et al. An appeal for an objective, open, and transparent scientific debate about the origin of SARS-CoV-2. Lancet. 2021;398(10309):1402-4. Epub 2021/09/21. doi: https://doi.org/10.1016/s0140-6736(21)02019-5. PubMed PMID: 34543608; PubMed Central PMCID: PMCPMC8448488 manuscript, integrated the other authors’ modifications, and managed the interactions with the editors. All the other authors contributed to the writing of the manuscript and acknowledged the latest version. We declare no competing interests.
- Piplani S, Kumar Singh P, Winler DA, Petrovsky N. In silico comparison of spike protein-ACE2 binding affinities across species and implications for virus origin. Scientific Reports. 2021;11(1):13063. doi: https://doi.org/10.1038/s41598-021-92388-5.
- Bruttel V, Washburne A, VanDongen A. Endonuclease fingerprint indicates a synthetic origin of SARS-CoV-2. bioRxiv. 2022:2022.10.18.512756. doi: https://doi.org/10.1101/2022.10.18.512756.
- Andersen KG, Rambaut A, Lipkin WI, Holmes EC, Garry RF. The proximal origin of SARS-CoV-2. Nature Medicine. 2020;26(4):450-2. doi: https://doi.org/10.1038/s41591-020-0820-9.
- Gøtzsche PC. The Chinese Virus: Killed Millions and Scientific Freedom. Copenhagen: Institute for Scientific Freedom; 2022.
- Dastar S, Gharesouran J, Mortazavi D, Hosseinzadeh H, Kian SJ, Taheri M, et al. COVID-19 pandemic: Insights into genetic susceptibility to SARS-CoV-2 and host genes implications on virus spread, disease severity and outcomes. Human Antibodies. 2022;30:1-14. doi: https://doi.org/10.3233/HAB-211506.
- Zepeda-Cervantes J, Martínez-Flores D, Ramírez-Jarquín JO, Tecalco-Cruz ÁC, Alavez-Pérez NS, Vaca L, et al. Implications of the Immune Polymorphisms of the Host and the Genetic Variability of SARS-CoV-2 in the Development of COVID-19. Viruses. 2022;14(1):94. PubMed PMID: doi: https://doi.org/10.3390/v14010094.
- Nguyen A, David JK, Maden SK, Wood MA, Weeder BR, Nellore A, et al. Human Leukocyte Antigen Susceptibility Map for Severe Acute Respiratory Syndrome Coronavirus 2. Journal of Virology. 2020;94(13):e00510-20. doi: https://doi.org/10.1128/JVI.00510-20.
- Jafarpour R, Pashangzadeh S, Dowran R. Host factors: Implications in immunopathogenesis of COVID-19. Pathology, research and practice. 2021;228:153647. Epub 2021/11/09. doi: https://doi.org/10.1016/j.prp.2021.153647. PubMed PMID: 34749207; PubMed Central PMCID: PMCPMC8505027.
- Hammer Q, Dunst J, Christ W, Picarazzi F, Wendorff M, Momayyezi P, et al. SARS-CoV-2 Nsp13 encodes for an HLA-E-stabilizing peptide that abrogates inhibition of NKG2A-expressing NK cells. Cell Reports. 2022;38(10). doi: https://doi.org/10.1016/j.celrep.2022.110503.
- Rockenfeller R, Günther M, Mörl F. Reports of deaths are an exaggeration: German (PCR-test-positive) fatality counts during the SARS-CoV-2 era in the context of all-cause mortality. MeRxiv. 2022; https://doi.org/10.1101/2022.11.18.22282534
- Levitt M, Zonta F, Ioannidis JPA. Excess death estimates from multiverse analysis in 2009-2021. medRxiv. 2022:2022.09.21.22280219. doi: https://doi.org/10.1101/2022.09.21.22280219.
- Levitt M, Zonta F, Ioannidis JPA. Comparison of pandemic excess mortality in 2020–2021 across different empirical calculations. Environmental Research. 2022;213:113754. doi: https://doi.org/10.1016/j.envres.2022.113754.
- Kuhbandner C, Homburg S, Walach H, Hockertz S. Was Germany’s Lockdown in Spring 2020 Necessary? How bad data quality can turn a simulation into a dissimulation that shapes the future. Futures. 2022;135:102879. doi: https://doi.org/10.1016/j.futures.2021.102879.